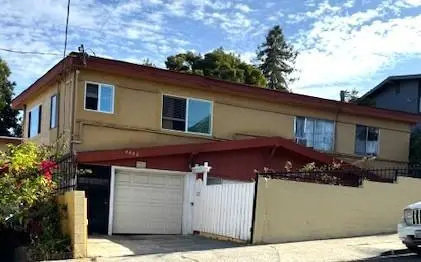
3002 Bona St
Oakland, CA 94601
$1,199,000F
10 bd · 9.0 ba ·
5,148 sqft ·
Built 1962
· MultiFamily
· Active
· 183 DOM
Cashflow @ list (25.0% down · 7.5%)
Estimated rent
$5,399/mo
Mortgage (P&I)
−$6,288
Tax + insurance
−$2,442
HOA
−$0
Vac / Maint / Mgmt
−$1,134
Net cashflow
$-4,464/mo
Annual
$-53,574/yr
Cap rate
1.82%
Cash-on-cash
-15.96%
DSCR
0.29
1% rule
0.45%
Cash to close
$335,720
Investor read
- This is a 2 × 2-bed/1-bath units multifamily listed at $1.20M.
- At list price, monthly cash flow is $-4k ($-54k/yr) — negative. Per door: $-2k/mo.
- To cash-flow at today's rent, offer at most $466k (61.1% below list).
- To meet the 1% rule (rent ≥ 1% of price), the offer needs to be $540k (55.0% below list).
- It's been on market 183 days — a 12% lower offer ($1.06M) is reasonable based on typical stale-listing flexibility.
- Recommended offer: $466k (61.1% below list) — sets the bar for cash-flow.
- Local home prices are declining (-3.0%/yr); year-one equity from $8k of loan paydown is wiped out by about $36k of value loss. Plan a longer hold.
- Location reads 71/100 on livability (#224 in CA) — a middle-class / working-renter tenant base. Strengths: amenities A+, commute A+, employment A+; Watch: schools C-, crime F, cost of living F.
- Oakland Unified (urban): math 27% / reading 33% proficiency, ranked #1,007 of 1,400 in CA (top 72%) — families likely to look elsewhere, expect single-tenant / working-renter base with shorter leases; 68% free/reduced lunch — lower-income household profile, screen leases tightly.
- Market conditions: Rents rising (+3.9%/yr); 116 active listings in the ZIP; 1,742 units permitted in Alameda County in 2024 (856 in 5+ unit buildings).
- Alameda County population projected at +34% by 2050 — long-run rental-demand tailwind backs the buy-and-hold thesis.
- 8 sale attempts since 32y ago with the ask held roughly flat each time — persistent listings suggest the price (not the market) is what's stuck; bring a comps-based counter.
- Current owner paid $830k; 44% above their basis — modest negotiation headroom, anchor on the comps not their cost.
- Cap rate 1.8% vs local median 2.4% in Oakland — below-typical yield; the buyer is paying a premium for something (appreciation thesis, condition, location) that the cap rate doesn't capture.
- At $5,399/mo this rent would consume 90% of the median local household income ($72k/yr) (locally 3603% of renters already pay >50% of income on rent) — very limited rent-growth headroom before tenants either downsize or default.
Questions for listing agent
- What do current leases actually rent for vs. the listed asking? Can we see a recent rent roll and the last 12 months of T-12 income?
- It's been on market 183 days. Have you received any prior offers? Is the seller open to a 61% concession, seller financing, or rate buy-down credit?
- Can we see the unit-by-unit rent roll, current vacancy, and any below-market leases? What's the average tenancy length?
- What capital expenditures (roof, boiler, parking lot, exteriors) have been made in the last 5 years, and what's planned in the next 2?
- Built in 1962 — when were the roof, HVAC, electrical panel, plumbing, and water heater last replaced?
- Why hasn't it sold? Are there any deal-killer items the seller is aware of (foundation, flood, title, zoning, code violations)?
- Is there a deadline driving the sale (1031 exchange, divorce, estate, relocation)? That informs how much negotiation room exists.
- Crime grade is F in this area — have there been break-ins, vandalism, or insurance claims at this property in the last 3 years? What carrier currently insures it and at what premium?
CashFlowRE · CFR-NJGCPBFZ14C7Z1
· Data 2 days ago
cashflowre.app · 2026-05-29