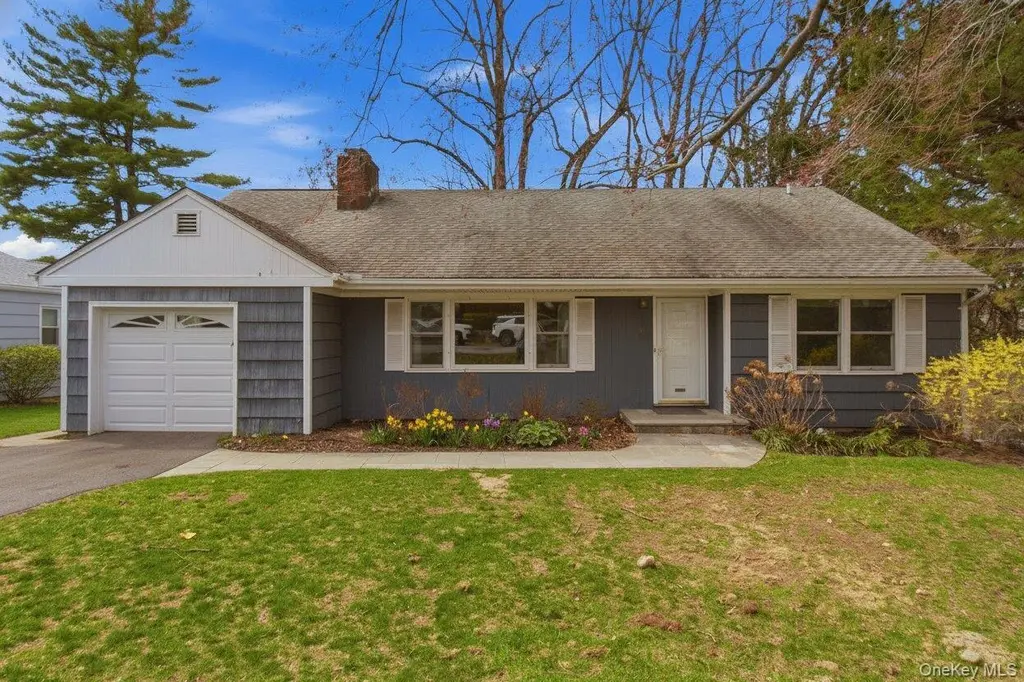
35 Forest Ave
Ossining, NY 10562
$695,000B-
5 bd · 2.0 ba ·
2,258 sqft ·
Built 1953
· SingleFamily
· Pending
· 27 DOM
Cashflow @ list (25.0% down · 7.5%)
Estimated rent
$8,874/mo
Mortgage (P&I)
−$3,645
Tax + insurance
−$1,679
HOA
−$0
Vac / Maint / Mgmt
−$1,864
Net cashflow
$1,686/mo
Annual
$20,238/yr
Cap rate
9.20%
Cash-on-cash
10.40%
DSCR
1.46
1% rule
1.28%
Cash to close
$194,600
Investor read
- This is a 5-bed/2.0-bath single-family listed at $695k.
- At list price, monthly cash flow is $2k ($20k/yr) — positive.
- The deal already cash-flows at list — no discount required.
- Meets the 1% rule at list price ($9k rent vs $695k).
- It's been on market 27 days — a 2% lower offer ($685k) is reasonable based on typical stale-listing flexibility.
- Recommended offer: $685k (1.5% below list) — sets the bar for market timing.
- Local home prices are declining (-3.0%/yr); year-one equity from $5k of loan paydown is wiped out by about $21k of value loss. Plan a longer hold.
- Location reads 80/100 on livability (#116 in NY, #1,876 nationally) — a professional / high-income tenant draw. Strengths: commute A+, employment A+, health & safety A; Watch: schools D+, cost of living F.
- Ossining Union Free School District (suburban): math 72% / reading 72% proficiency, ranked #104 of 590 in NY (top 18%) — strong family-tenant draw, lease renewals of 3-5y typical.
- Watch-outs: built in 1953 — expect roof / HVAC / electrical / plumbing capex.
- Market conditions: 134 active listings in the ZIP; 3 comparable units currently listed for rent nearby; rentals leasing fast (median 1d on market — plan ~1-2 weeks tenant-placement turnaround); high-income renter base; 954 units permitted in Westchester County in 2024 (649 in 5+ unit buildings).
- Westchester County population projected at +10% by 2050 — modest demand growth; plan on rents tracking national, not racing it.
- Current owner paid $130k; list at $695k implies a 435% gain — meaningful room to come down on a strong offer.
- Climate carrying-cost: moderate wind risk, 26% chance of damaging wind over 30y; extreme-heat days projected 7→15/yr by 2055 (HVAC capex compounding) — expect insurance premiums to compound above CPI over the hold.
- Cap rate 9.2% vs local median 2.9% in Ossining — top-decile yield for the area; either an underpriced asset or a hidden risk that comps aren't pricing in. Stress-test before assuming the spread holds.
- At $8,874/mo this rent would consume 92% of the median local household income ($116k/yr) (locally 1248% of renters already pay >50% of income on rent) — very limited rent-growth headroom before tenants either downsize or default.
Questions for listing agent
- Built in 1953 — when were the roof, HVAC, electrical panel, plumbing, and water heater last replaced?
- Is there a deadline driving the sale (1031 exchange, divorce, estate, relocation)? That informs how much negotiation room exists.
- Schools are D-rated, which usually means shorter tenancies and higher turnover. Who's the typical renter profile here, and what's been the actual vacancy rate?
- What's the average days-on-market for RENTAL listings here right now (not sales)? A rising rental-DOM trend means longer vacancies and softer asking-rent achievability than the comps imply.
- What's the recent tenant-quality profile in this submarket — average credit score on applications, eviction rate, late-payment / NSF rate, and stable-employment percentage? A property-management company in the area should have these aggregated.
- How much new for-sale + rental construction is in the pipeline within 1–3 miles? Heavy new supply typically softens prices + rents 12–24 months out; constrained supply supports both.
CashFlowRE · CFR-NNCSSECTJ1P2TS
· Data 3 weeks ago
cashflowre.app · 2026-05-29