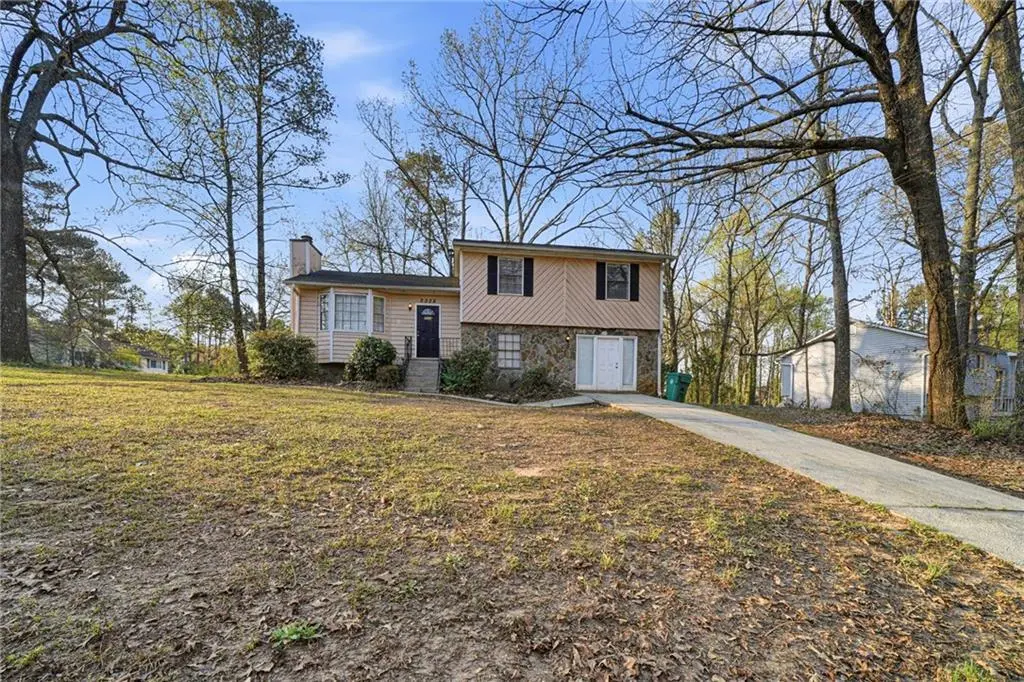
3339 Tarragon Dr
Stonecrest, GA 30034
$209,000B-
3 bd · 2.0 ba ·
2,027 sqft ·
Built 1981
· SingleFamily
· Pending
· 82 DOM
Cashflow @ list (25.0% down · 7.5%)
Estimated rent
$2,544/mo
Mortgage (P&I)
−$1,096
Tax + insurance
−$471
HOA
−$0
Vac / Maint / Mgmt
−$534
Net cashflow
$443/mo
Annual
$5,311/yr
Cap rate
8.83%
Cash-on-cash
9.08%
DSCR
1.40
1% rule
1.22%
Cash to close
$58,520
Investor read
- This is a 3-bed/2.0-bath single-family listed at $209k.
- At list price, monthly cash flow is $443 ($5k/yr) — positive.
- The deal already cash-flows at list — no discount required.
- Meets the 1% rule at list price ($3k rent vs $209k).
- It's been on market 82 days — a 6% lower offer ($196k) is reasonable based on typical stale-listing flexibility.
- Recommended offer: $196k (6.0% below list) — sets the bar for market timing.
- Local home prices are declining (-3.0%/yr); year-one equity from $1k of loan paydown is wiped out by about $6k of value loss. Plan a longer hold.
- Location reads: area grade B — affects rentability + tenant quality, not the cash-flow math above.
- Dekalb County (suburban): math 19% / reading 28% proficiency, ranked #125 of 174 in GA (top 72%) — low school quality limits family demand, transient renter base, plan for 1-2y turnover; 68% free/reduced lunch — lower-income household profile, screen leases tightly.
- Market conditions: Rents rising (+2.2%/yr); 353 active listings in the ZIP; 18 comparable units currently listed for rent nearby; rentals at typical pace (median 25d on market — plan ~3-4 weeks tenant-placement turnaround); 44% of comp listings sitting > 30 days — soft ceiling on asking rent; 1,240 units permitted in DeKalb County in 2024 (385 in 5+ unit buildings).
- DeKalb County population projected at +28% by 2050 — long-run rental-demand tailwind backs the buy-and-hold thesis.
- 9 sale attempts since 18y ago with the ask held roughly flat each time — persistent listings suggest the price (not the market) is what's stuck; bring a comps-based counter.
- Climate carrying-cost: moderate wind risk, 26% chance of damaging wind over 30y; extreme-heat days projected 7→18/yr by 2055 (HVAC capex compounding) — expect insurance premiums to compound above CPI over the hold.
- Cap rate 8.8% vs local median 5.1% in Stonecrest — top-decile yield for the area; either an underpriced asset or a hidden risk that comps aren't pricing in. Stress-test before assuming the spread holds.
- At $2,544/mo this rent would consume 48% of the median local household income ($64k/yr) (locally 1659% of renters already pay >50% of income on rent) — very limited rent-growth headroom before tenants either downsize or default.
Questions for listing agent
- It's been on market 82 days. Have you received any prior offers? Is the seller open to a 6% concession, seller financing, or rate buy-down credit?
- Why hasn't it sold? Are there any deal-killer items the seller is aware of (foundation, flood, title, zoning, code violations)?
- Is there a deadline driving the sale (1031 exchange, divorce, estate, relocation)? That informs how much negotiation room exists.
- What's the average days-on-market for RENTAL listings here right now (not sales)? A rising rental-DOM trend means longer vacancies and softer asking-rent achievability than the comps imply.
- What's the recent tenant-quality profile in this submarket — average credit score on applications, eviction rate, late-payment / NSF rate, and stable-employment percentage? A property-management company in the area should have these aggregated.
- How much new for-sale + rental construction is in the pipeline within 1–3 miles? Heavy new supply typically softens prices + rents 12–24 months out; constrained supply supports both.
CashFlowRE · CFR-NRPBZYBCP6P8PB
· Data 3 days ago
cashflowre.app · 2026-05-29