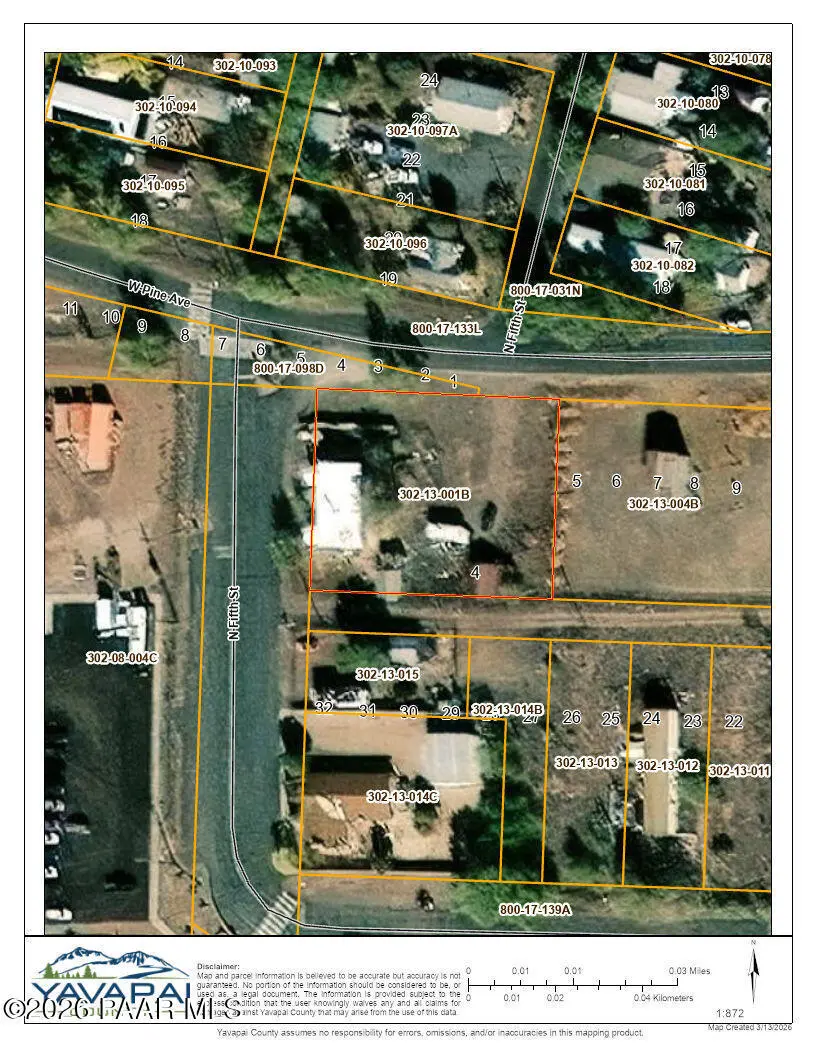
47077 5th St
Ash Fork, AZ 86320
$184,900C
3 bd · 2.0 ba ·
1,274 sqft ·
Built 1951
· SingleFamily
· Pending
Cashflow @ list (25.0% down · 7.5%)
Estimated rent
$1,436/mo
Mortgage (P&I)
−$970
Tax + insurance
−$159
HOA
−$0
Vac / Maint / Mgmt
−$302
Net cashflow
$6/mo
Annual
$66/yr
Cap rate
6.33%
Cash-on-cash
0.13%
DSCR
1.01
1% rule
0.78%
Cash to close
$51,772
Investor read
- This is a 3-bed/2.0-bath single-family listed at $185k.
- At list price, monthly cash flow is $6 ($66/yr) — positive.
- The deal already cash-flows at list — no discount required.
- To meet the 1% rule (rent ≥ 1% of price), the offer needs to be $144k (22.3% below list).
- Only 0 days on market — expect competitive offers; lowballing is unlikely to land.
- Recommended offer: $144k (22.3% below list) — sets the bar for 1% rule.
- In year one you build about $20k of equity ($1k loan paydown + $18k appreciation (10.0% local appreciation)).
- Location reads 65/100 on livability (#87 in AZ) — a middle-class / working-renter tenant base. Strengths: cost of living A+, housing A+; Watch: crime F, amenities F, commute F.
- Ash Fork Joint Unified District (4471) (rural): math 65% / reading 65% proficiency, ranked #58 of 501 in AZ (top 12%) — acceptable for families but not a draw, mixed tenant base, ~2y average lease; 87% free/reduced lunch — lower-income household profile, screen leases tightly.
- Zoned schools: Ash Fork Elementary School (math 44% / reading 44%, grade F, #339 of 1,109 statewide, top 32%, 119 students, 79% FRL); Ash Fork Middle School (math 47% / reading 57%, grade C+, #21 of 218 statewide, top 9%, 74 students, 77% FRL); Ash Fork High School (math 50% / reading 50%, grade D, #38 of 381 statewide, top 11%, 100 students, 75% FRL).
- Zoned-school proficiency averages 49% at this address vs 65% district-wide (-16 pts) — the specific schools serving this property underperform the Ash Fork Joint Unified District (4471) average; the district grade overstates school quality for this exact location.
- Watch-outs: built in 1951 — expect roof / HVAC / electrical / plumbing capex.
- Market conditions: 160 active listings in the ZIP; 2,062 units permitted in Yavapai County in 2024 (98 in 5+ unit buildings).
- Yavapai County population projected at +10% by 2050 — modest demand growth; plan on rents tracking national, not racing it.
- At projected returns (10.0% appreciation + 3.0% rent growth), your $52k cash investment doubles in ~3 years — after that, you're playing with house money.
- By year 2, paydown + projected appreciation supports a ~$32k cash-out refi (75% LTV) — recoverable capital for the next deal without selling this one.
- Climate carrying-cost: moderate wildfire risk — expect insurance premiums to compound above CPI over the hold.
Questions for listing agent
- Built in 1951 — when were the roof, HVAC, electrical panel, plumbing, and water heater last replaced?
- Is there a deadline driving the sale (1031 exchange, divorce, estate, relocation)? That informs how much negotiation room exists.
- Crime grade is F in this area — have there been break-ins, vandalism, or insurance claims at this property in the last 3 years? What carrier currently insures it and at what premium?
- What's the average days-on-market for RENTAL listings here right now (not sales)? A rising rental-DOM trend means longer vacancies and softer asking-rent achievability than the comps imply.
- What's the recent tenant-quality profile in this submarket — average credit score on applications, eviction rate, late-payment / NSF rate, and stable-employment percentage? A property-management company in the area should have these aggregated.
- How much new for-sale + rental construction is in the pipeline within 1–3 miles? Heavy new supply typically softens prices + rents 12–24 months out; constrained supply supports both.
CashFlowRE · CFR-NT7A0Z10T0NJ8Q
· Data 4 weeks ago
cashflowre.app · 2026-05-29