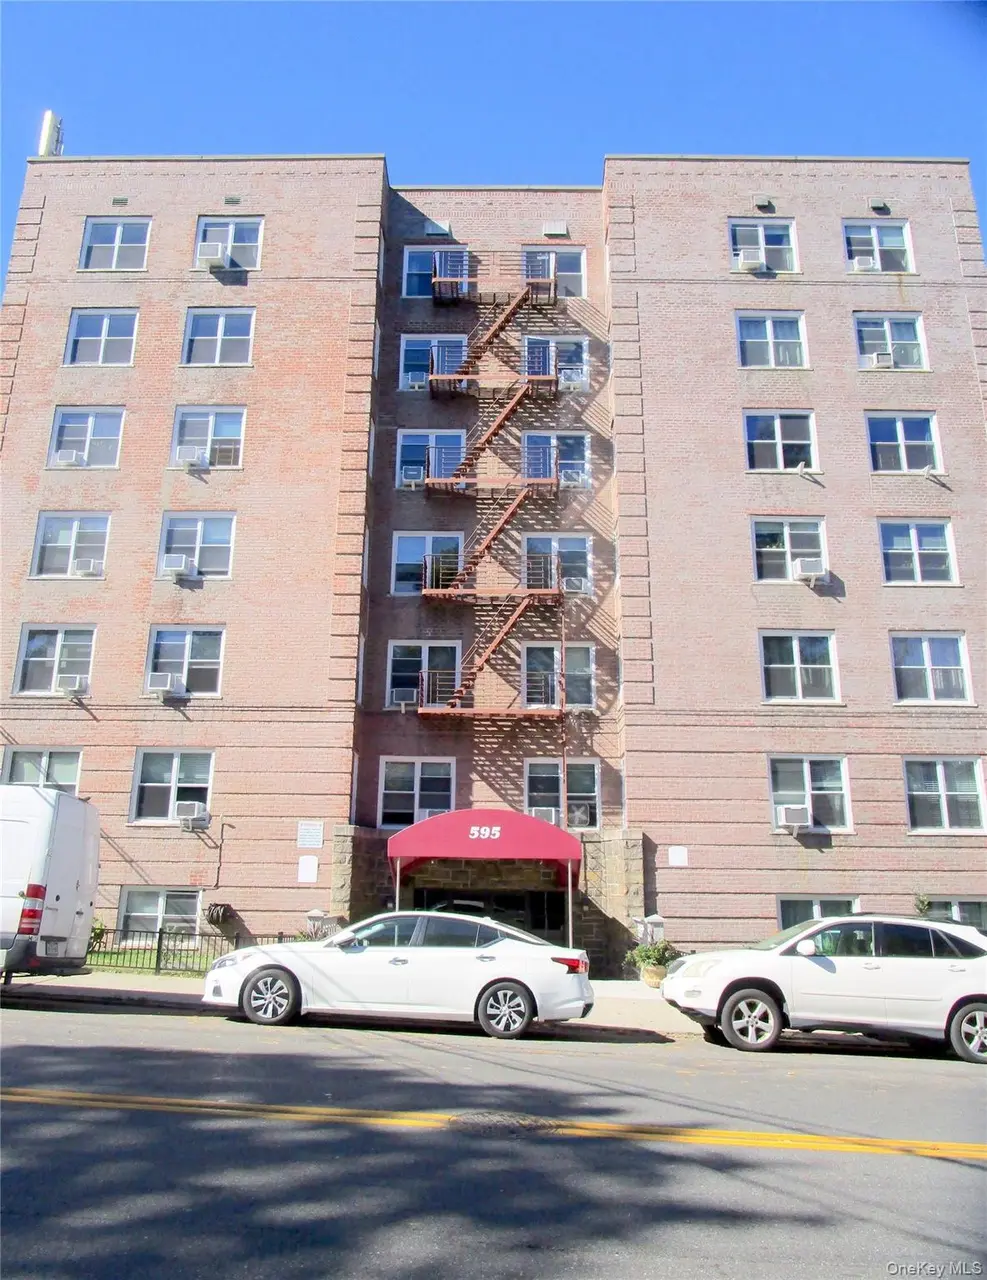
595 Mclean Ave Unit 6B
Yonkers, NY 10705
$169,000B
1 bd · 1.0 ba ·
800 sqft ·
Built 1954
· Condo
· Active
· 12 DOM
Cashflow @ list (25.0% down · 7.5%)
Estimated rent
$2,362/mo
Mortgage (P&I)
−$886
Tax + insurance
−$282
HOA
−$0
Vac / Maint / Mgmt
−$496
Net cashflow
$698/mo
Annual
$8,376/yr
Cap rate
11.25%
Cash-on-cash
17.70%
DSCR
1.79
1% rule
1.40%
Cash to close
$47,320
Investor read
- This is a 1-bed/1.0-bath condo listed at $169k. Condition is rated good.
- At list price, monthly cash flow is $698 ($8k/yr) — positive.
- The deal already cash-flows at list — no discount required.
- Meets the 1% rule at list price ($2k rent vs $169k).
- Only 12 days on market — expect competitive offers; lowballing is unlikely to land.
- Local home prices are declining (-3.0%/yr); year-one equity from $1k of loan paydown is wiped out by about $5k of value loss. Plan a longer hold.
- Location reads 68/100 on livability (#528 in NY) — a middle-class / working-renter tenant base. Strengths: employment A, commute B; Watch: amenities F, cost of living F.
- Yonkers City School District (suburban): math 41% / reading 54% proficiency, ranked #413 of 590 in NY (top 70%) — families likely to look elsewhere, expect single-tenant / working-renter base with shorter leases; 64% free/reduced lunch — lower-income household profile, screen leases tightly.
- Watch-outs: built in 1954 — expect roof / HVAC / electrical / plumbing capex.
- Market conditions: Rents rising fast (+9.0%/yr); 86 active listings in the ZIP; 21 comparable units currently listed for rent nearby; rentals at typical pace (median 26d on market — plan ~3-4 weeks tenant-placement turnaround); 954 units permitted in Westchester County in 2024 (649 in 5+ unit buildings).
- Westchester County population projected at +10% by 2050 — modest demand growth; plan on rents tracking national, not racing it.
- At projected returns (-3.0% appreciation + 8.0% rent growth), your $47k cash investment doubles in ~6 years — after that, you're playing with house money.
- Climate carrying-cost: major wind risk, 27% chance of damaging wind over 30y; extreme-heat days projected 6→13/yr by 2055 (HVAC capex compounding) — expect insurance premiums to compound above CPI over the hold.
- Cap rate 11.2% vs local median 5.3% in Yonkers — top-decile yield for the area; either an underpriced asset or a hidden risk that comps aren't pricing in. Stress-test before assuming the spread holds.
- This rent runs 42% of the median local income ($68k/yr) — at the standard rent-burdened threshold; future hikes will face affordability resistance.
Questions for listing agent
- Built in 1954 — when were the roof, HVAC, electrical panel, plumbing, and water heater last replaced?
- Any open or pending special assessments — roof, HVAC, plumbing, elevator, façade? What's the per-unit balance and payoff schedule, and is the seller paying it off at close or rolling it to the buyer?
- Is there a deadline driving the sale (1031 exchange, divorce, estate, relocation)? That informs how much negotiation room exists.
- What's the average days-on-market for RENTAL listings here right now (not sales)? A rising rental-DOM trend means longer vacancies and softer asking-rent achievability than the comps imply.
- What's the recent tenant-quality profile in this submarket — average credit score on applications, eviction rate, late-payment / NSF rate, and stable-employment percentage? A property-management company in the area should have these aggregated.
- How much new apartment / multifamily construction is in the pipeline within 1–3 miles? Heavy new supply (>2% of stock underway) typically softens rents 12–24 months out; light construction supports rent growth.
CashFlowRE · CFR-NVGH7RCRHNC42S
· Data 1 week ago
cashflowre.app · 2026-05-29