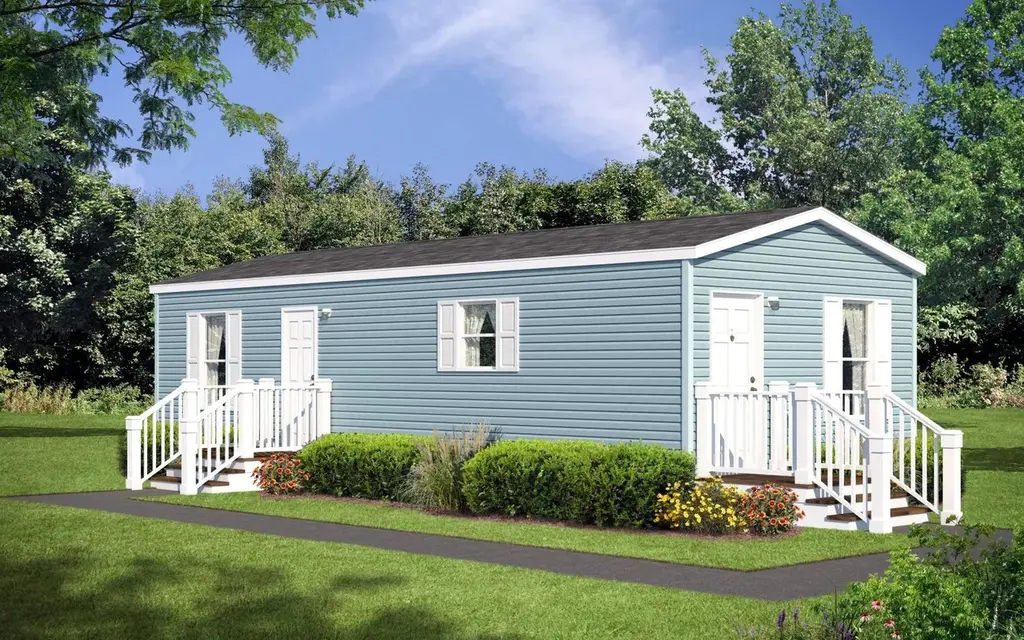
Pike (Sawyier) Plan
Georgetown, KY 40324
$54,995D+
1 bd · 1.0 ba ·
546 sqft ·
Built —
· SingleFamily
· Active
· 323 DOM
Cashflow @ list (25.0% down · 7.5%)
Estimated rent
$1,074/mo
Mortgage (P&I)
−$288
Tax + insurance
−$92
HOA
−$500
Vac / Maint / Mgmt
−$226
Net cashflow
$-32/mo
Annual
$-379/yr
Cap rate
5.60%
Cash-on-cash
-2.46%
DSCR
0.89
1% rule
1.95%
Cash to close
$15,399
Investor read
- This is a 1-bed/1.0-bath single-family listed at $55k. Condition is rated good.
- At list price, monthly cash flow is $-32 ($-379/yr) — negative.
- To cash-flow at today's rent, offer at most $50k (8.3% below list).
- Meets the 1% rule at list price ($1k rent vs $55k).
- It's been on market 323 days — a 12% lower offer ($48k) is reasonable based on typical stale-listing flexibility.
- Recommended offer: $48k (12.0% below list) — sets the bar for market timing.
- Local home prices are declining (-3.0%/yr); year-one equity from $380 of loan paydown is wiped out by about $2k of value loss. Plan a longer hold.
- Location reads 78/100 on livability (#75 in KY, #2,338 nationally) — a middle-class / working-renter tenant base. Strengths: cost of living A+, housing A+, health & safety A+; Watch: amenities D, commute F.
- Scott County (town): math 32% / reading 44% proficiency, ranked #31 of 165 in KY (top 19%) — families likely to look elsewhere, expect single-tenant / working-renter base with shorter leases.
- Zoned schools: Western Elementary School (math 48% / reading 49%, grade D, #110 of 676 statewide, top 17%, 624 students, 34% FRL); Scott County Middle School (math 38% / reading 53%, grade D+, #32 of 217 statewide, top 15%, 864 students, 35% FRL); Scott County High School (math 34% / reading 37%, grade F, #73 of 254 statewide, top 28%, 1,197 students, 40% FRL) — zoned schools at 36% FRL track the district average.
- Watch-outs: HOA is 47% of rent.
- Market conditions: Rents rising (+3.0%/yr); 437 active listings in the ZIP; solid renter incomes; 546 units permitted in Scott County in 2024 (98 in 5+ unit buildings).
- Scott County population projected at +45% by 2050 — long-run rental-demand tailwind backs the buy-and-hold thesis.
- Cap rate 5.6% vs local median 3.5% in Georgetown — top-decile yield for the area; either an underpriced asset or a hidden risk that comps aren't pricing in. Stress-test before assuming the spread holds.
- This rent is only 15% of the median local income ($85k/yr) — well below the 30% rent-burden line; pricing power to push rent on renewal without tenant pushback.
Questions for listing agent
- What do current leases actually rent for vs. the listed asking? Can we see a recent rent roll and the last 12 months of T-12 income?
- It's been on market 323 days. Have you received any prior offers? Is the seller open to a 12% concession, seller financing, or rate buy-down credit?
- What does the HOA fee cover, when was the last increase, and are there any pending special assessments or reserve-fund shortfalls?
- Why hasn't it sold? Are there any deal-killer items the seller is aware of (foundation, flood, title, zoning, code violations)?
- Is there a deadline driving the sale (1031 exchange, divorce, estate, relocation)? That informs how much negotiation room exists.
- Schools are D-rated, which usually means shorter tenancies and higher turnover. Who's the typical renter profile here, and what's been the actual vacancy rate?
- The area grade is low — what's the realistic commute time and amenity access for the typical tenant pool here? Any planned neighborhood developments (good or bad) we should know about?
- What's the average days-on-market for RENTAL listings here right now (not sales)? A rising rental-DOM trend means longer vacancies and softer asking-rent achievability than the comps imply.
CashFlowRE · CFR-NWQTZ51AZ37Q2G
· Data 10 h ago
cashflowre.app · 2026-05-29