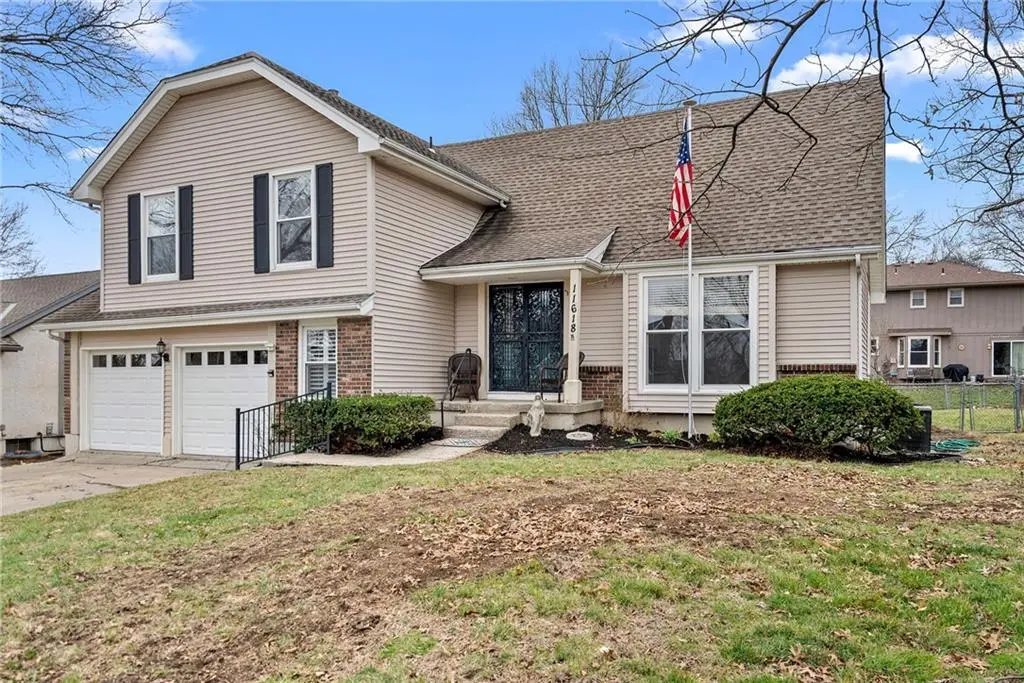
11618 Cherry St
Kansas City, MO 64114
$330,000D-
4 bd · 2.5 ba ·
2,054 sqft ·
Built 1976
· SingleFamily
· Pending
· 38 DOM
Cashflow @ list (25.0% down · 7.5%)
Estimated rent
$2,234/mo
Mortgage (P&I)
−$1,731
Tax + insurance
−$449
HOA
−$0
Vac / Maint / Mgmt
−$469
Net cashflow
$-414/mo
Annual
$-4,970/yr
Cap rate
4.79%
Cash-on-cash
-5.38%
DSCR
0.76
1% rule
0.68%
Cash to close
$92,400
Investor read
- This is a 4-bed/2.5-bath single-family listed at $330k.
- At list price, monthly cash flow is $-414 ($-5k/yr) — negative.
- To cash-flow at today's rent, offer at most $257k (22.2% below list).
- To meet the 1% rule (rent ≥ 1% of price), the offer needs to be $223k (32.3% below list).
- It's been on market 38 days — a 3% lower offer ($320k) is reasonable based on typical stale-listing flexibility.
- Recommended offer: $223k (32.3% below list) — sets the bar for 1% rule.
- Local home prices are declining (-3.0%/yr); year-one equity from $2k of loan paydown is wiped out by about $10k of value loss. Plan a longer hold.
- Location reads 78/100 on livability (#28 in MO, #2,671 nationally) — a middle-class / working-renter tenant base. Strengths: amenities A+, commute A+, cost of living A+; Watch: crime F.
- Grandview C-4 (suburban): math 17% / reading 32% proficiency, ranked #284 of 324 in MO (top 88%) — low school quality limits family demand, transient renter base, plan for 1-2y turnover; 65% free/reduced lunch — lower-income household profile, screen leases tightly.
- Zoned schools: Martin City Elem. (math 15% / reading 27%, grade F, #929 of 1,115 statewide, top 83%, 668 students, 71% FRL); Grandview Middle (math 18% / reading 39%, grade F, #303 of 391 statewide, top 78%, 517 students, 68% FRL); Grandview Sr. High (math 15% / reading 41%, grade F, #414 of 521 statewide, top 80%, 1,122 students, 62% FRL) — zoned schools at 67% FRL track the district average.
- Market conditions: Rents rising fast (+4.6%/yr); 179 active listings in the ZIP; 1 comparable units currently listed for rent nearby; solid renter incomes; 4,002 units permitted in Jackson County in 2024 (2,271 in 5+ unit buildings).
- Jackson County population projected at +4% by 2050 — modest demand growth; plan on rents tracking national, not racing it.
- 2 sale attempts with the ask held roughly flat each time — persistent listings suggest the price (not the market) is what's stuck; bring a comps-based counter.
- Cap rate 4.8% vs local median 3.9% in Kansas City — meaningfully above typical; check what's discounted (condition, days-on-market, listing class) to confirm the premium yield is real.
- This rent runs 33% of the median local income ($81k/yr) — at the standard rent-burdened threshold; future hikes will face affordability resistance.
Questions for listing agent
- What do current leases actually rent for vs. the listed asking? Can we see a recent rent roll and the last 12 months of T-12 income?
- It's been on market 38 days. Have you received any prior offers? Is the seller open to a 32% concession, seller financing, or rate buy-down credit?
- Built in 1976 — when were the roof, HVAC, electrical panel, plumbing, and water heater last replaced?
- Is there a deadline driving the sale (1031 exchange, divorce, estate, relocation)? That informs how much negotiation room exists.
- Crime grade is F in this area — have there been break-ins, vandalism, or insurance claims at this property in the last 3 years? What carrier currently insures it and at what premium?
- The area grade is low — what's the realistic commute time and amenity access for the typical tenant pool here? Any planned neighborhood developments (good or bad) we should know about?
- What's the average days-on-market for RENTAL listings here right now (not sales)? A rising rental-DOM trend means longer vacancies and softer asking-rent achievability than the comps imply.
- What's the recent tenant-quality profile in this submarket — average credit score on applications, eviction rate, late-payment / NSF rate, and stable-employment percentage? A property-management company in the area should have these aggregated.
CashFlowRE · CFR-NXR4ZQ24NW54CH
· Data 4 weeks ago
cashflowre.app · 2026-05-29