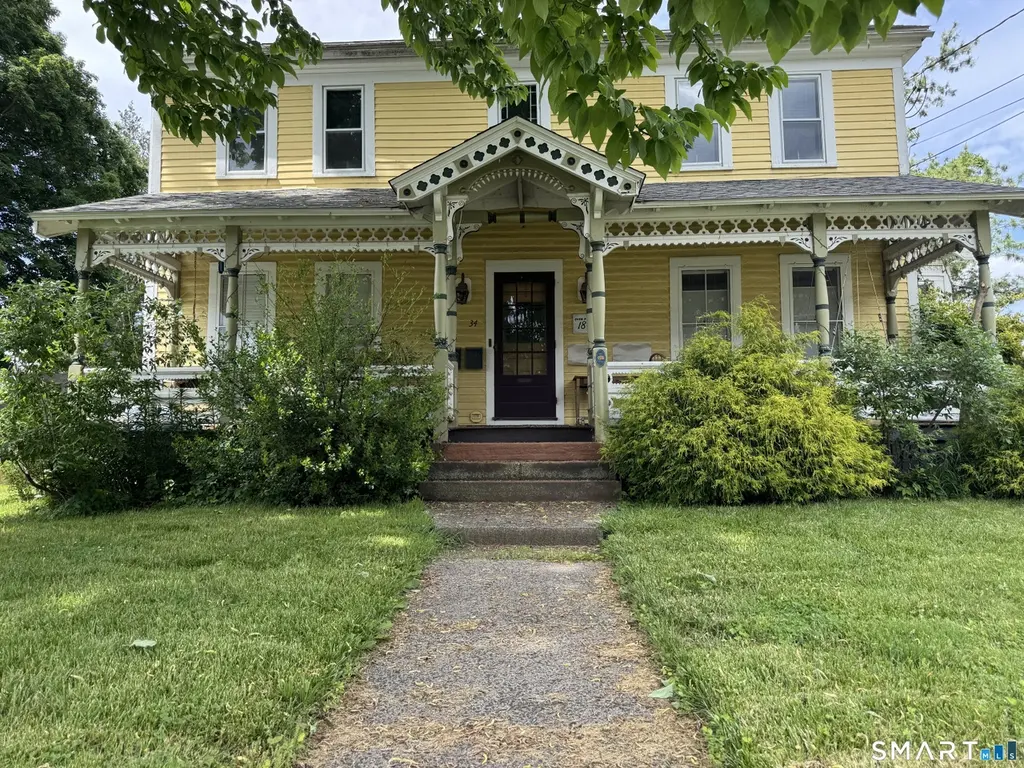
32 Broad St
East Hartford, CT 06118
$399,900C-
3 bd · 2.0 ba ·
2,843 sqft ·
Built 1800
· MultiFamily
· Active
· 3 DOM
Cashflow @ list (25.0% down · 7.5%)
Estimated rent
$4,513/mo
Mortgage (P&I)
−$2,097
Tax + insurance
−$835
HOA
−$0
Vac / Maint / Mgmt
−$948
Net cashflow
$634/mo
Annual
$7,602/yr
Cap rate
8.19%
Cash-on-cash
6.79%
DSCR
1.30
1% rule
1.13%
Cash to close
$111,972
Investor read
- This is a 2 × 2-bed/1.0-bath units multifamily listed at $400k.
- At list price, monthly cash flow is $634 ($8k/yr) — positive. Per door: $317/mo.
- The deal already cash-flows at list — no discount required.
- Meets the 1% rule at list price ($5k rent vs $400k).
- Only 3 days on market — expect competitive offers; lowballing is unlikely to land.
- Local home prices are declining (-3.0%/yr); year-one equity from $3k of loan paydown is wiped out by about $12k of value loss. Plan a longer hold.
- Location reads 73/100 on livability (#76 in CT) — a middle-class / working-renter tenant base. Strengths: housing A+, crime A, commute A-; Watch: amenities F, health & safety F.
- East Hartford School District (urban): math 17% / reading 30% proficiency, ranked #140 of 153 in CT (top 92%) — low school quality limits family demand, transient renter base, plan for 1-2y turnover.
- Zoned schools: East Hartford Middle School (math 12% / reading 26%, grade F, #163 of 175 statewide, top 94%, 890 students, 70% FRL); East Hartford High School (math 11% / reading 33%, grade F, #156 of 194 statewide, top 82%, 1,698 students, 63% FRL).
- Watch-outs: built in 1800 — expect roof / HVAC / electrical / plumbing capex.
- Market conditions: 99 active listings in the ZIP; solid renter incomes; 1,867 units permitted in Capitol Planning Region in 2024 (1,399 in 5+ unit buildings).
- 3 sale attempts since 25y ago with the ask held roughly flat each time — persistent listings suggest the price (not the market) is what's stuck; bring a comps-based counter.
- Current owner paid $167k; list at $400k implies a 139% gain — meaningful room to come down on a strong offer.
- Cap rate 8.2% vs local median 4.1% in East Hartford — top-decile yield for the area; either an underpriced asset or a hidden risk that comps aren't pricing in. Stress-test before assuming the spread holds.
- At $4,513/mo this rent would consume 68% of the median local household income ($80k/yr) (locally 820% of renters already pay >50% of income on rent) — very limited rent-growth headroom before tenants either downsize or default.
Questions for listing agent
- Can we see the unit-by-unit rent roll, current vacancy, and any below-market leases? What's the average tenancy length?
- What capital expenditures (roof, boiler, parking lot, exteriors) have been made in the last 5 years, and what's planned in the next 2?
- Built in 1800 — when were the roof, HVAC, electrical panel, plumbing, and water heater last replaced?
- Is there a deadline driving the sale (1031 exchange, divorce, estate, relocation)? That informs how much negotiation room exists.
- Schools are D-rated, which usually means shorter tenancies and higher turnover. Who's the typical renter profile here, and what's been the actual vacancy rate?
- What's the average days-on-market for RENTAL listings here right now (not sales)? A rising rental-DOM trend means longer vacancies and softer asking-rent achievability than the comps imply.
- What's the recent tenant-quality profile in this submarket — average credit score on applications, eviction rate, late-payment / NSF rate, and stable-employment percentage? A property-management company in the area should have these aggregated.
- How much new apartment / multifamily construction is in the pipeline within 1–3 miles? Heavy new supply (>2% of stock underway) typically softens rents 12–24 months out; light construction supports rent growth.
CashFlowRE · CFR-NYF19KEGZ9MXXW
· Data 3 weeks ago
cashflowre.app · 2026-05-29