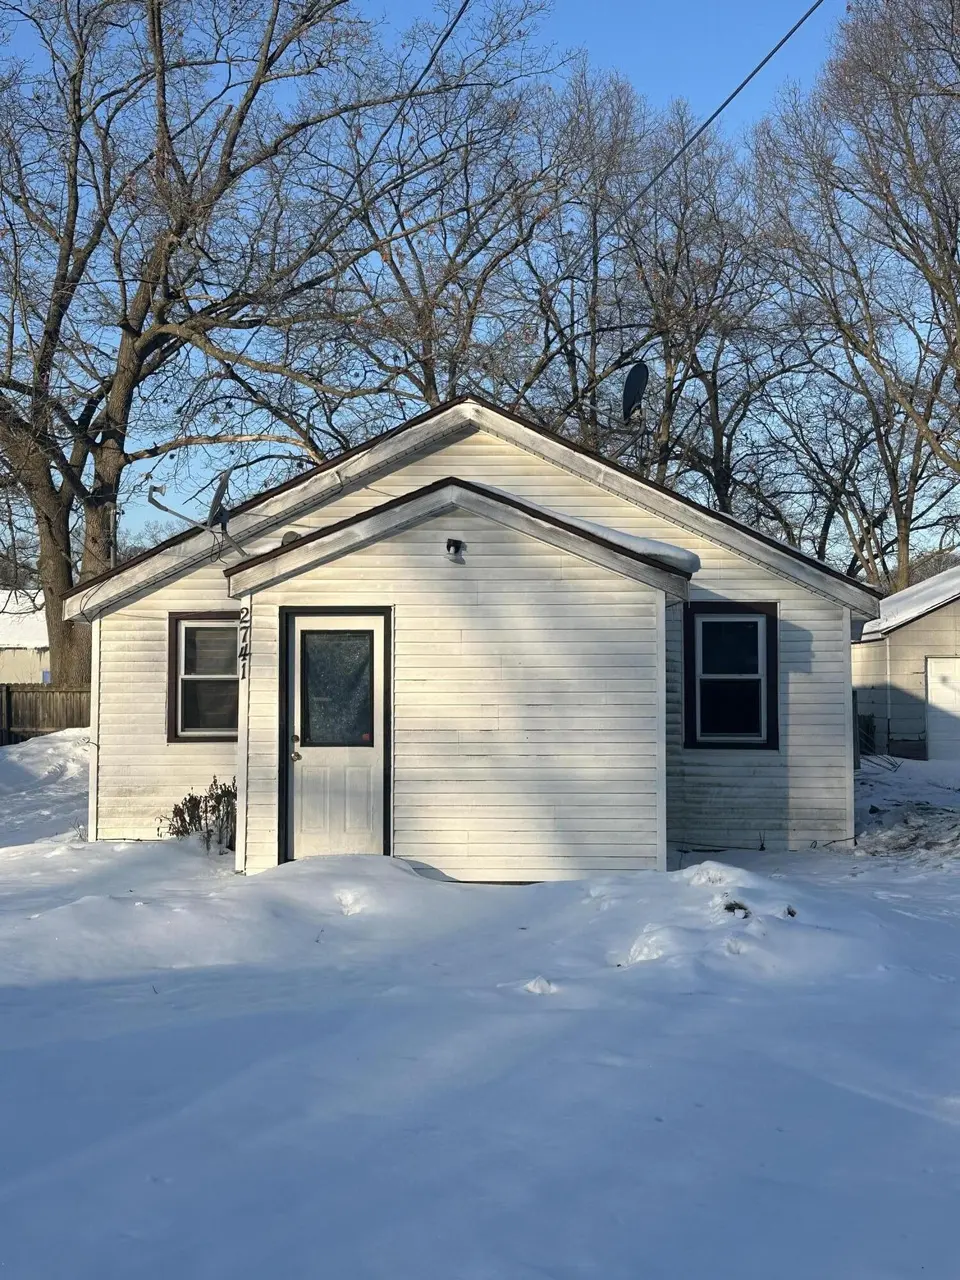
2741 Roberts St
Norton Shores, MI 49444
$74,900B
2 bd · 1.0 ba ·
864 sqft ·
Built 1938
· SingleFamily
· Pending
· 75 DOM
Cashflow @ list (25.0% down · 7.5%)
Estimated rent
$1,100/mo
Mortgage (P&I)
−$393
Tax + insurance
−$242
HOA
−$0
Vac / Maint / Mgmt
−$231
Net cashflow
$234/mo
Annual
$2,811/yr
Cap rate
10.05%
Cash-on-cash
13.41%
DSCR
1.60
1% rule
1.47%
Cash to close
$20,972
Investor read
- This is a 2-bed/1.0-bath single-family listed at $75k.
- At list price, monthly cash flow is $234 ($3k/yr) — positive.
- The deal already cash-flows at list — no discount required.
- Meets the 1% rule at list price ($1k rent vs $75k).
- It's been on market 75 days — a 6% lower offer ($70k) is reasonable based on typical stale-listing flexibility.
- Recommended offer: $70k (6.0% below list) — sets the bar for market timing.
- Local home prices are declining (-3.0%/yr); year-one equity from $518 of loan paydown is wiped out by about $2k of value loss. Plan a longer hold.
- Location reads 70/100 on livability (#310 in MI) — a middle-class / working-renter tenant base. Strengths: cost of living A+, housing A+, crime B; Watch: amenities F, commute F, health & safety F.
- Muskegon Public Schools Of The City Of (urban): math 4% / reading 12% proficiency, ranked #534 of 540 in MI (top 99%) — low school quality limits family demand, transient renter base, plan for 1-2y turnover; 81% free/reduced lunch — lower-income household profile, screen leases tightly.
- Zoned schools: Muskegon Middle School (math 4% / reading 13%, grade F, #480 of 493 statewide, top 97%, 755 students, 87% FRL); Muskegon High School (math 8% / reading 27%, grade F, #632 of 713 statewide, top 89%, 1,039 students, 84% FRL) — zoned schools at 85% FRL track the district average.
- Watch-outs: property tax is 3.4% of price; built in 1938 — expect roof / HVAC / electrical / plumbing capex.
- Market conditions: 239 active listings in the ZIP; 2 comparable units currently listed for rent nearby; 438 units permitted in Muskegon County in 2024 (115 in 5+ unit buildings).
- Muskegon County population projected to shrink 8% by 2050 — rents likely to lag national; underwrite the cash flow, not the appreciation.
- 8 sale attempts since 28y ago; this cycle's ask has dropped $15k (17%) from the opening price — seller is motivated, your offer sets the floor, not the list.
- At projected returns (-3.0% appreciation + 3.0% rent growth), your $21k cash investment doubles in ~9 years — after that, you're playing with house money.
- Cap rate 10.0% vs local median 3.3% in Norton Shores — top-decile yield for the area; either an underpriced asset or a hidden risk that comps aren't pricing in. Stress-test before assuming the spread holds.
Questions for listing agent
- It's been on market 75 days. Have you received any prior offers? Is the seller open to a 6% concession, seller financing, or rate buy-down credit?
- Built in 1938 — when were the roof, HVAC, electrical panel, plumbing, and water heater last replaced?
- Property tax is high relative to price — has the assessment been appealed recently, and will the sale trigger a re-assessment?
- Why hasn't it sold? Are there any deal-killer items the seller is aware of (foundation, flood, title, zoning, code violations)?
- Is there a deadline driving the sale (1031 exchange, divorce, estate, relocation)? That informs how much negotiation room exists.
- Schools are B-rated — typically a magnet for longer-tenancy family renters. What's the average tenant stay here, and is there a school-zone premium baked into asking?
- What's the average days-on-market for RENTAL listings here right now (not sales)? A rising rental-DOM trend means longer vacancies and softer asking-rent achievability than the comps imply.
- What's the recent tenant-quality profile in this submarket — average credit score on applications, eviction rate, late-payment / NSF rate, and stable-employment percentage? A property-management company in the area should have these aggregated.
CashFlowRE · CFR-NZQA1VAWYSBZ0X
· Data 4 weeks ago
cashflowre.app · 2026-05-29