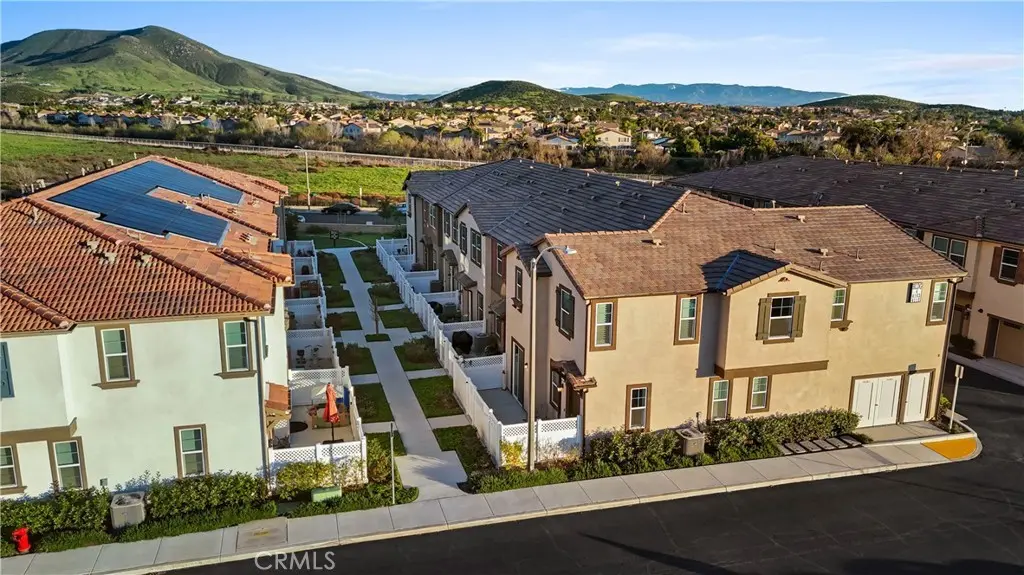
34495 Agave Dr #4110
French Valley, CA 92596
$430,000D+
3 bd · 2.5 ba ·
1,400 sqft ·
Built 2022
· Townhouse
· Active
· 2 DOM
Cashflow @ list (25.0% down · 7.5%)
Estimated rent
$3,379/mo
Mortgage (P&I)
−$2,255
Tax + insurance
−$532
HOA
−$305
Vac / Maint / Mgmt
−$710
Net cashflow
$-423/mo
Annual
$-5,071/yr
Cap rate
5.11%
Cash-on-cash
-4.21%
DSCR
0.81
1% rule
0.79%
Cash to close
$120,400
Investor read
- This is a 3-bed/2.5-bath townhouse listed at $430k.
- At list price, monthly cash flow is $-423 ($-5k/yr) — negative.
- To cash-flow at today's rent, offer at most $355k (17.4% below list).
- To meet the 1% rule (rent ≥ 1% of price), the offer needs to be $338k (21.4% below list).
- Only 2 days on market — expect competitive offers; lowballing is unlikely to land.
- Recommended offer: $338k (21.4% below list) — sets the bar for 1% rule.
- In year one you build about $46k of equity ($3k loan paydown + $43k appreciation (10.0% local appreciation)).
- Location reads 59/100 on livability (#655 in CA) — a working-class tenant base; expect higher turnover. Strengths: employment A+, housing A+; Watch: schools D-, crime D-, amenities F.
- Temecula Valley Unified (urban): math 55% / reading 69% proficiency, ranked #173 of 1,400 in CA (top 12%) — acceptable for families but not a draw, mixed tenant base, ~2y average lease; only 17% free/reduced lunch — higher-income household profile.
- Market conditions: Rents soft (-0.8%/yr); 355 active listings in the ZIP; 8 comparable units currently listed for rent nearby; rentals at typical pace (median 18d on market — plan ~3-4 weeks tenant-placement turnaround); high-income renter base; 9,195 units permitted in Riverside County in 2024 (1,512 in 5+ unit buildings).
- Riverside County population projected at +22% by 2050 — long-run rental-demand tailwind backs the buy-and-hold thesis.
- By year 2, paydown + projected appreciation supports a ~$74k cash-out refi (75% LTV) — recoverable capital for the next deal without selling this one.
- Cap rate 5.1% vs local median 3.6% in French Valley — top-decile yield for the area; either an underpriced asset or a hidden risk that comps aren't pricing in. Stress-test before assuming the spread holds.
- This rent runs 31% of the median local income ($133k/yr) — at the standard rent-burdened threshold; future hikes will face affordability resistance.
Questions for listing agent
- What do current leases actually rent for vs. the listed asking? Can we see a recent rent roll and the last 12 months of T-12 income?
- What does the HOA fee cover, when was the last increase, and are there any pending special assessments or reserve-fund shortfalls?
- Is there a deadline driving the sale (1031 exchange, divorce, estate, relocation)? That informs how much negotiation room exists.
- Schools are D-rated, which usually means shorter tenancies and higher turnover. Who's the typical renter profile here, and what's been the actual vacancy rate?
- Crime grade is D in this area — have there been break-ins, vandalism, or insurance claims at this property in the last 3 years? What carrier currently insures it and at what premium?
- The area grade is low — what's the realistic commute time and amenity access for the typical tenant pool here? Any planned neighborhood developments (good or bad) we should know about?
- What's the average days-on-market for RENTAL listings here right now (not sales)? A rising rental-DOM trend means longer vacancies and softer asking-rent achievability than the comps imply.
- What's the recent tenant-quality profile in this submarket — average credit score on applications, eviction rate, late-payment / NSF rate, and stable-employment percentage? A property-management company in the area should have these aggregated.
CashFlowRE · CFR-P47CWECE07Q1V3
· Data 2 days ago
cashflowre.app · 2026-05-29