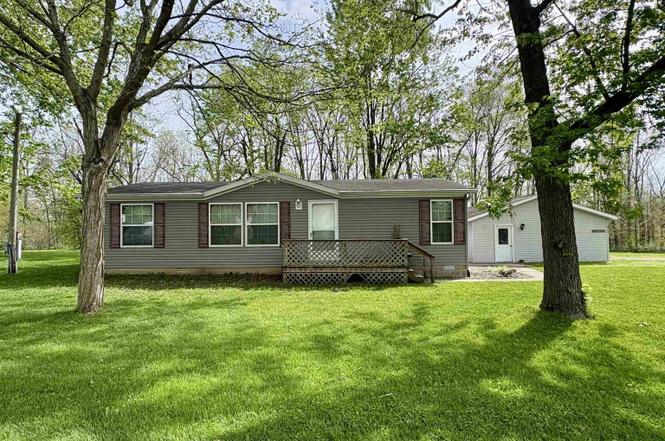
619 E 6th St
Warren, IN 46792
$150,000D
3 bd · 2.0 ba ·
1,188 sqft ·
Built 2009
· SingleFamily
· Pending
· 88 DOM
Cashflow @ list (25.0% down · 7.5%)
Estimated rent
$1,135/mo
Mortgage (P&I)
−$787
Tax + insurance
−$118
HOA
−$0
Vac / Maint / Mgmt
−$238
Net cashflow
$-8/mo
Annual
$-94/yr
Cap rate
6.23%
Cash-on-cash
-0.22%
DSCR
0.99
1% rule
0.76%
Cash to close
$42,000
Investor read
- This is a 3-bed/2.0-bath single-family listed at $150k.
- At list price, monthly cash flow is $-8 ($-94/yr) — negative.
- To cash-flow at today's rent, offer at most $149k (0.9% below list).
- To meet the 1% rule (rent ≥ 1% of price), the offer needs to be $113k (24.3% below list).
- It's been on market 88 days — a 6% lower offer ($141k) is reasonable based on typical stale-listing flexibility.
- Recommended offer: $113k (24.3% below list) — sets the bar for 1% rule.
- Local home prices are declining (-3.0%/yr); year-one equity from $1k of loan paydown is wiped out by about $4k of value loss. Plan a longer hold.
- Location reads 71/100 on livability (#137 in IN) — a middle-class / working-renter tenant base. Strengths: crime A+, cost of living A+, housing A+; Watch: health & safety C-, amenities F, commute F.
- Huntington County Community School Corporation (rural): math 34% / reading 39% proficiency, ranked #176 of 301 in IN (top 58%) — families likely to look elsewhere, expect single-tenant / working-renter base with shorter leases.
- Zoned schools: Salamonie Elementary School (math 52% / reading 42%, grade D-, #325 of 994 statewide, top 36%, 286 students, 46% FRL); Riverview School (math 29% / reading 40%, grade F, #167 of 330 statewide, top 52%, 503 students, 54% FRL); Huntington North High School (math 30% / reading 55%, grade F, #195 of 369 statewide, top 53%, 1,424 students, 42% FRL).
- Market conditions: 12 active listings in the ZIP; 79 units permitted in Huntington County in 2024 (0 in 5+ unit buildings).
- Huntington County population projected at -14% by 2050 — secular population decline; favor cash flow + early exit over multi-decade hold.
Questions for listing agent
- What do current leases actually rent for vs. the listed asking? Can we see a recent rent roll and the last 12 months of T-12 income?
- It's been on market 88 days. Have you received any prior offers? Is the seller open to a 24% concession, seller financing, or rate buy-down credit?
- Why hasn't it sold? Are there any deal-killer items the seller is aware of (foundation, flood, title, zoning, code violations)?
- Is there a deadline driving the sale (1031 exchange, divorce, estate, relocation)? That informs how much negotiation room exists.
- The area grade is low — what's the realistic commute time and amenity access for the typical tenant pool here? Any planned neighborhood developments (good or bad) we should know about?
- What's the average days-on-market for RENTAL listings here right now (not sales)? A rising rental-DOM trend means longer vacancies and softer asking-rent achievability than the comps imply.
- What's the recent tenant-quality profile in this submarket — average credit score on applications, eviction rate, late-payment / NSF rate, and stable-employment percentage? A property-management company in the area should have these aggregated.
- How much new for-sale + rental construction is in the pipeline within 1–3 miles? Heavy new supply typically softens prices + rents 12–24 months out; constrained supply supports both.
CashFlowRE · CFR-P6ZYE87JSXJPDS
· Data 6 days ago
cashflowre.app · 2026-05-29