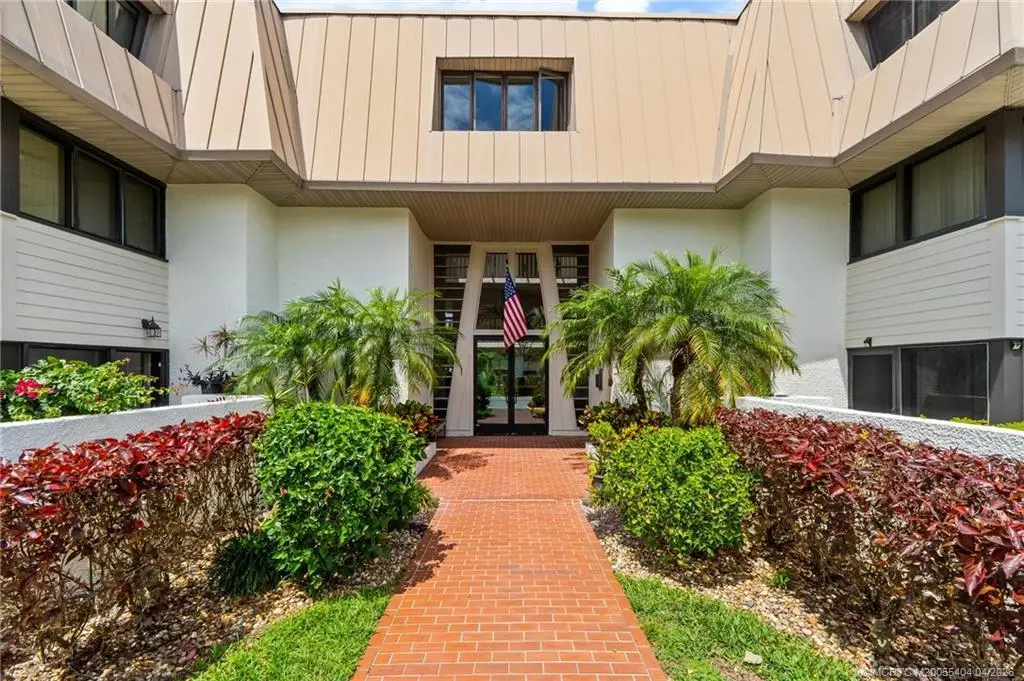
1800 SE Saint Lucie Blvd Unit 6-203
Sewall's Point, FL 34996
$199,999C
2 bd · 2.0 ba ·
1,044 sqft ·
Built 1973
· Condo
· Active
· 55 DOM
Cashflow @ list (25.0% down · 7.5%)
Estimated rent
$2,647/mo
Mortgage (P&I)
−$1,049
Tax + insurance
−$151
HOA
−$951
Vac / Maint / Mgmt
−$556
Net cashflow
$-60/mo
Annual
$-715/yr
Cap rate
5.94%
Cash-on-cash
-1.28%
DSCR
0.94
1% rule
1.32%
Cash to close
$56,000
Investor read
- This is a 2-bed/2.0-bath condo listed at $200k.
- At list price, monthly cash flow is $-60 ($-715/yr) — negative.
- To cash-flow at today's rent, offer at most $189k (5.3% below list).
- Meets the 1% rule at list price ($3k rent vs $200k).
- It's been on market 55 days — a 3% lower offer ($194k) is reasonable based on typical stale-listing flexibility.
- Recommended offer: $189k (5.3% below list) — sets the bar for cash-flow.
- In year one you build about $21k of equity ($1k loan paydown + $20k appreciation (10.0% local appreciation)).
- Location reads: area grade C — affects rentability + tenant quality, not the cash-flow math above.
- Martin (suburban): math 52% / reading 53% proficiency, ranked #24 of 73 in FL (top 33%) — acceptable for families but not a draw, mixed tenant base, ~2y average lease.
- Zoned schools: Stuart Middle School (math 55% / reading 55%, grade B-, #180 of 571 statewide, top 32%, 867 students, 49% FRL); Jensen Beach High School (math 53% / reading 71%, grade B-, #98 of 667 statewide, top 15%, 1,584 students, 36% FRL) — zoned schools at 42% FRL track the district average.
- Watch-outs: HOA is 36% of rent.
- Market conditions: 251 active listings in the ZIP; 18 comparable units currently listed for rent nearby; rentals at typical pace (median 24d on market — plan ~3-4 weeks tenant-placement turnaround); solid renter incomes; 737 units permitted in Martin County in 2024 (167 in 5+ unit buildings).
- Martin County population projected at +19% by 2050 — long-run rental-demand tailwind backs the buy-and-hold thesis.
- 8 sale attempts since 23y ago with the ask held roughly flat each time — persistent listings suggest the price (not the market) is what's stuck; bring a comps-based counter.
- Current owner paid $75k; list at $200k implies a 167% gain — meaningful room to come down on a strong offer.
- At projected returns (10.0% appreciation + 3.0% rent growth), your $56k cash investment doubles in ~3 years — after that, you're playing with house money.
- By year 2, paydown + projected appreciation supports a ~$34k cash-out refi (75% LTV) — recoverable capital for the next deal without selling this one.
- Climate carrying-cost: major flood risk; severe wind risk, 99% chance of damaging wind over 30y; extreme-heat days projected 7→25/yr by 2055 (HVAC capex compounding) — expect insurance premiums to compound above CPI over the hold.
Questions for listing agent
- What do current leases actually rent for vs. the listed asking? Can we see a recent rent roll and the last 12 months of T-12 income?
- It's been on market 55 days. Have you received any prior offers? Is the seller open to a 5% concession, seller financing, or rate buy-down credit?
- Built in 1973 — when were the roof, HVAC, electrical panel, plumbing, and water heater last replaced?
- What does the HOA fee cover, when was the last increase, and are there any pending special assessments or reserve-fund shortfalls?
- Any open or pending special assessments — roof, HVAC, plumbing, elevator, façade? What's the per-unit balance and payoff schedule, and is the seller paying it off at close or rolling it to the buyer?
- Is there a deadline driving the sale (1031 exchange, divorce, estate, relocation)? That informs how much negotiation room exists.
- What's the average days-on-market for RENTAL listings here right now (not sales)? A rising rental-DOM trend means longer vacancies and softer asking-rent achievability than the comps imply.
- What's the recent tenant-quality profile in this submarket — average credit score on applications, eviction rate, late-payment / NSF rate, and stable-employment percentage? A property-management company in the area should have these aggregated.
CashFlowRE · CFR-P889Z5DBYJ3FEX
· Data 2 days ago
cashflowre.app · 2026-05-29