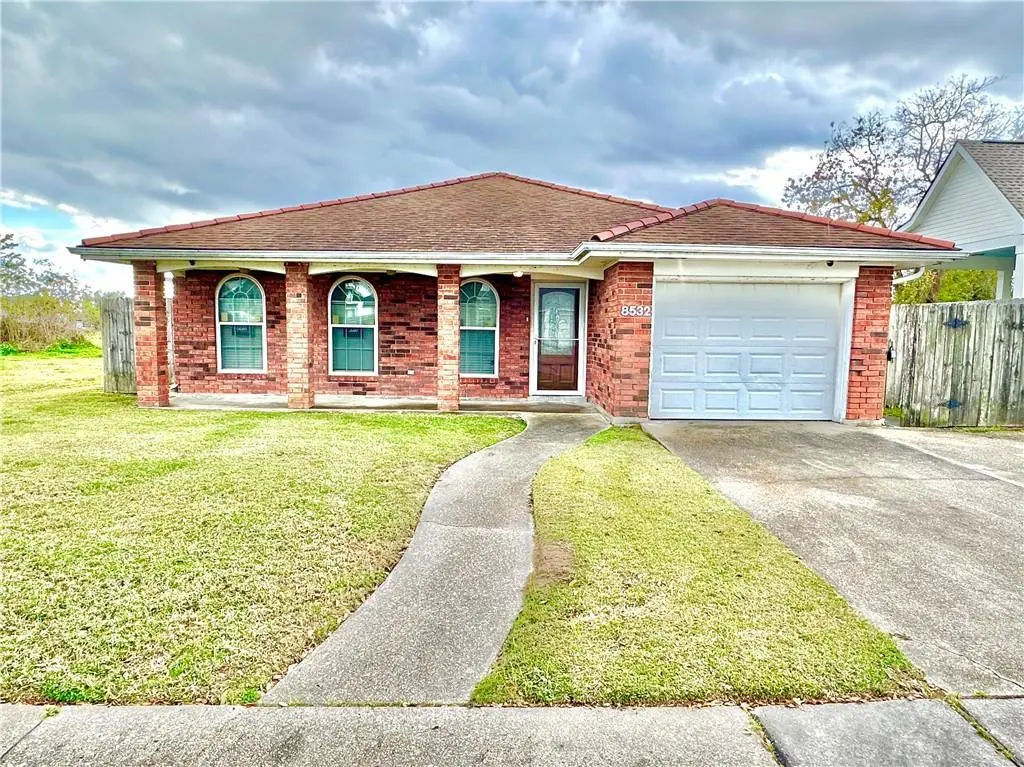
8532 Benjamin Dr
Chalmette, LA 70043
$184,500B-
3 bd · 2.0 ba ·
1,654 sqft ·
Built 1982
· SingleFamily
· Active
· 182 DOM
Cashflow @ list (25.0% down · 7.5%)
Estimated rent
$1,887/mo
Mortgage (P&I)
−$968
Tax + insurance
−$553
HOA
−$0
Vac / Maint / Mgmt
−$396
Net cashflow
$-30/mo
Annual
$-355/yr
Cap rate
8.87%
Cash-on-cash
9.22%
DSCR
1.41
1% rule
1.02%
Cash to close
$51,660
Investor read
- This is a 3-bed/2.0-bath single-family listed at $184k.
- At list price, monthly cash flow is $-30 ($-355/yr) — negative.
- To cash-flow at today's rent, offer at most $179k (2.8% below list).
- Meets the 1% rule at list price ($2k rent vs $184k).
- It's been on market 182 days — a 12% lower offer ($162k) is reasonable based on typical stale-listing flexibility.
- Recommended offer: $162k (12.0% below list) — sets the bar for market timing.
- Local home prices are declining (-3.0%/yr); year-one equity from $1k of loan paydown is wiped out by about $6k of value loss. Plan a longer hold.
- Location reads 65/100 on livability (#137 in LA) — a middle-class / working-renter tenant base. Strengths: cost of living A+, housing A+, health & safety A; Watch: crime F, amenities F, commute F.
- Watch-outs: flood insurance adds $427/mo.
- Market conditions: Rents rising (+3.1%/yr); 209 active listings in the ZIP; 33 comparable units currently listed for rent nearby; rentals at typical pace (median 17d on market — plan ~3-4 weeks tenant-placement turnaround); 112 units permitted in St. Bernard Parish in 2024 (0 in 5+ unit buildings).
- St. Bernard County population projected at +89% by 2050 — long-run rental-demand tailwind backs the buy-and-hold thesis.
- 10 sale attempts since 23y ago; this cycle's ask has dropped $15k (8%) from the opening price — seller is motivated, your offer sets the floor, not the list.
- Current owner paid $60k; list at $184k implies a 207% gain — meaningful room to come down on a strong offer.
- Climate carrying-cost: in FEMA flood zone AE (mandatory federal flood insurance); severe wind risk, 99% chance of damaging wind over 30y; extreme-heat days projected 7→21/yr by 2055 (HVAC capex compounding) — expect insurance premiums to compound above CPI over the hold.
- Cap rate 8.9% vs local median 5.5% in Chalmette — top-decile yield for the area; either an underpriced asset or a hidden risk that comps aren't pricing in. Stress-test before assuming the spread holds.
- This rent runs 41% of the median local income ($55k/yr) — at the standard rent-burdened threshold; future hikes will face affordability resistance.
Questions for listing agent
- What do current leases actually rent for vs. the listed asking? Can we see a recent rent roll and the last 12 months of T-12 income?
- It's been on market 182 days. Have you received any prior offers? Is the seller open to a 12% concession, seller financing, or rate buy-down credit?
- What's the actual annual flood-insurance premium (NFIP or private), and is the property in a SFHA with mandatory coverage?
- Why hasn't it sold? Are there any deal-killer items the seller is aware of (foundation, flood, title, zoning, code violations)?
- Is there a deadline driving the sale (1031 exchange, divorce, estate, relocation)? That informs how much negotiation room exists.
- Crime grade is F in this area — have there been break-ins, vandalism, or insurance claims at this property in the last 3 years? What carrier currently insures it and at what premium?
- What's the average days-on-market for RENTAL listings here right now (not sales)? A rising rental-DOM trend means longer vacancies and softer asking-rent achievability than the comps imply.
- What's the recent tenant-quality profile in this submarket — average credit score on applications, eviction rate, late-payment / NSF rate, and stable-employment percentage? A property-management company in the area should have these aggregated.
CashFlowRE · CFR-P9SAS3465DGNNP
· Data 2 days ago
cashflowre.app · 2026-05-29