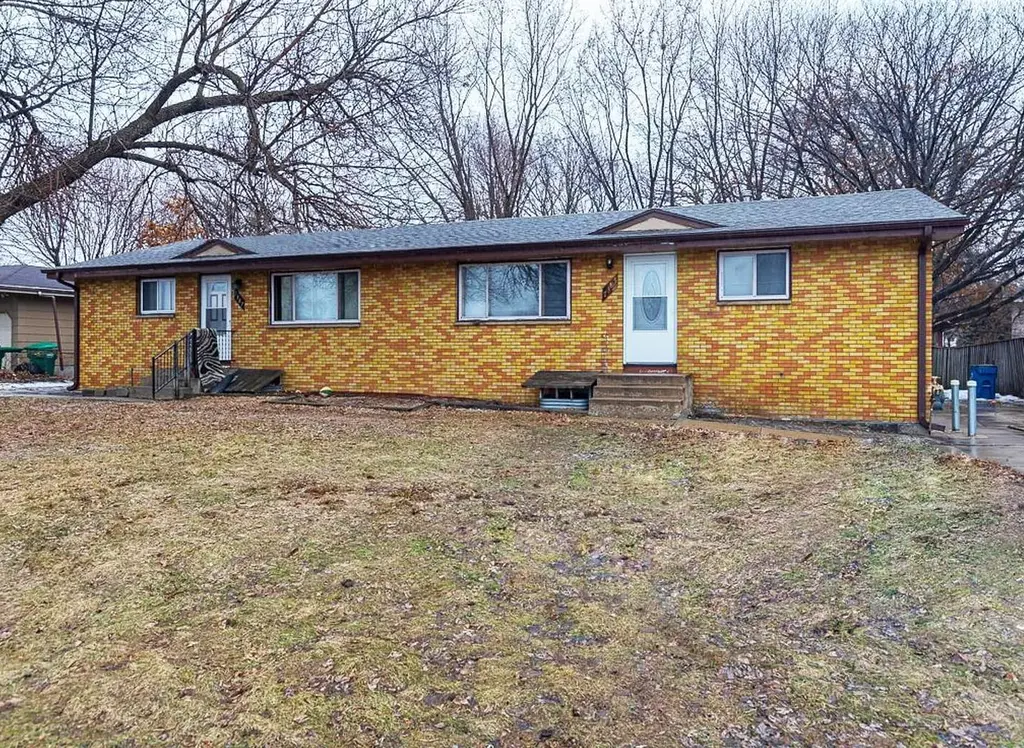
7385 University Ave NE
Fridley, MN 55432
$449,900D
5 bd · 2.0 ba ·
1,664 sqft ·
Built 1964
· MultiFamily
· Pending
· 14 DOM
Cashflow @ list (25.0% down · 7.5%)
Estimated rent
$3,734/mo
Mortgage (P&I)
−$2,359
Tax + insurance
−$669
HOA
−$0
Vac / Maint / Mgmt
−$784
Net cashflow
$-79/mo
Annual
$-943/yr
Cap rate
6.08%
Cash-on-cash
-0.75%
DSCR
0.97
1% rule
0.83%
Cash to close
$125,972
Investor read
- This is a 2 × 4-bed/1.5-bath units multifamily listed at $450k.
- At list price, monthly cash flow is $-79 ($-943/yr) — negative. Per door: $-39/mo.
- To cash-flow at today's rent, offer at most $436k (3.1% below list).
- To meet the 1% rule (rent ≥ 1% of price), the offer needs to be $373k (17.0% below list).
- Only 14 days on market — expect competitive offers; lowballing is unlikely to land.
- Recommended offer: $373k (17.0% below list) — sets the bar for 1% rule.
- Local home prices are declining (-3.0%/yr); year-one equity from $3k of loan paydown is wiped out by about $13k of value loss. Plan a longer hold.
- Location reads 75/100 on livability (#185 in MN, #3,977 nationally) — a middle-class / working-renter tenant base. Strengths: commute A+, housing A+, employment B+; Watch: crime C-, amenities F, health & safety F.
- Spring Lake Park Public Schools (suburban): math 41% / reading 49% proficiency, ranked #162 of 301 in MN (top 54%) — families likely to look elsewhere, expect single-tenant / working-renter base with shorter leases.
- Market conditions: Rents rising fast (+5.8%/yr); 100 active listings in the ZIP; 1 comparable units currently listed for rent nearby; solid renter incomes; 1,083 units permitted in Anoka County in 2024 (134 in 5+ unit buildings).
- Anoka County population projected at +11% by 2050 — modest demand growth; plan on rents tracking national, not racing it.
- 10 sale attempts since 29y ago; this cycle's ask is 23641% above the opening price — seller raised mid-cycle; expect resistance to lowballs.
- Current owner paid $50k; list at $450k implies a 791% gain — meaningful room to come down on a strong offer.
- Cap rate 6.1% vs local median 3.1% in Fridley — top-decile yield for the area; either an underpriced asset or a hidden risk that comps aren't pricing in. Stress-test before assuming the spread holds.
- At $3,734/mo this rent would consume 56% of the median local household income ($80k/yr) (locally 954% of renters already pay >50% of income on rent) — very limited rent-growth headroom before tenants either downsize or default.
Questions for listing agent
- What do current leases actually rent for vs. the listed asking? Can we see a recent rent roll and the last 12 months of T-12 income?
- Can we see the unit-by-unit rent roll, current vacancy, and any below-market leases? What's the average tenancy length?
- What capital expenditures (roof, boiler, parking lot, exteriors) have been made in the last 5 years, and what's planned in the next 2?
- Built in 1964 — when were the roof, HVAC, electrical panel, plumbing, and water heater last replaced?
- Is there a deadline driving the sale (1031 exchange, divorce, estate, relocation)? That informs how much negotiation room exists.
- The area grade is low — what's the realistic commute time and amenity access for the typical tenant pool here? Any planned neighborhood developments (good or bad) we should know about?
- What's the average days-on-market for RENTAL listings here right now (not sales)? A rising rental-DOM trend means longer vacancies and softer asking-rent achievability than the comps imply.
- What's the recent tenant-quality profile in this submarket — average credit score on applications, eviction rate, late-payment / NSF rate, and stable-employment percentage? A property-management company in the area should have these aggregated.
CashFlowRE · CFR-PAS9GK05VX6BVZ
· Data 1 week ago
cashflowre.app · 2026-05-29