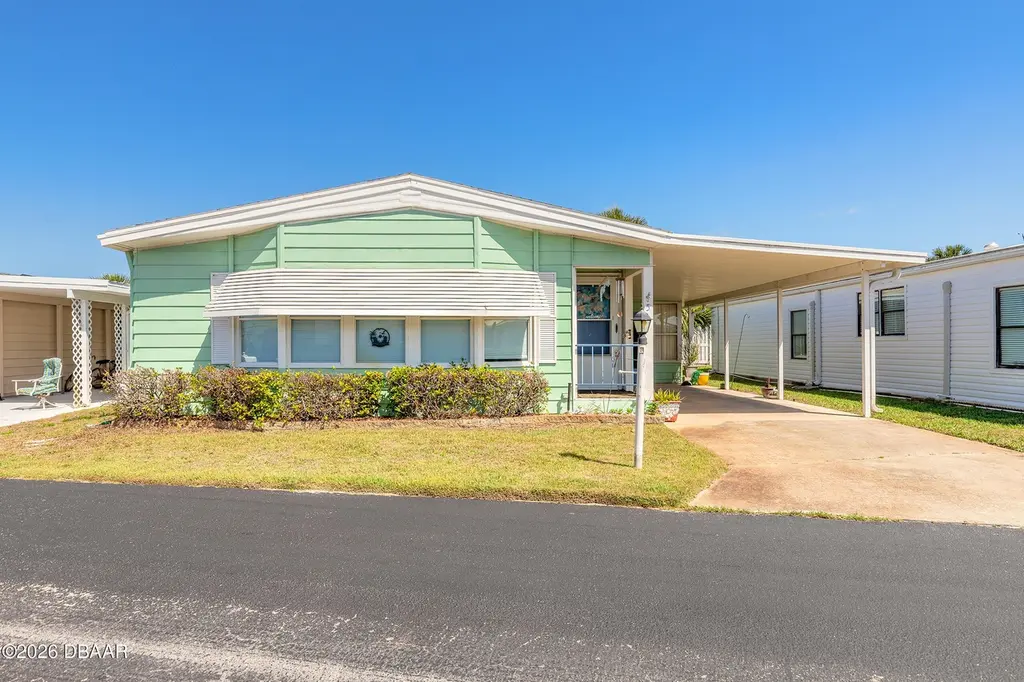
5 Windward Dr
Beverly Beach, FL 32136
$219,788C-
2 bd · 2.0 ba ·
1,332 sqft ·
Built 1986
· Condo
· Active
· 71 DOM
Cashflow @ list (25.0% down · 7.5%)
Estimated rent
$2,494/mo
Mortgage (P&I)
−$1,153
Tax + insurance
−$401
HOA
−$220
Vac / Maint / Mgmt
−$524
Net cashflow
$197/mo
Annual
$2,362/yr
Cap rate
7.73%
Cash-on-cash
5.13%
DSCR
1.23
1% rule
1.13%
Cash to close
$61,541
Investor read
- This is a 2-bed/2.0-bath condo listed at $220k.
- At list price, monthly cash flow is $197 ($2k/yr) — positive.
- The deal already cash-flows at list — no discount required.
- Meets the 1% rule at list price ($2k rent vs $220k).
- It's been on market 71 days — a 6% lower offer ($207k) is reasonable based on typical stale-listing flexibility.
- Recommended offer: $207k (6.0% below list) — sets the bar for market timing.
- Local home prices are declining (-3.0%/yr); year-one equity from $2k of loan paydown is wiped out by about $7k of value loss. Plan a longer hold.
- Location reads 63/100 on livability (#714 in FL) — a middle-class / working-renter tenant base. Strengths: cost of living A+, housing A+, crime A; Watch: health & safety C-, employment D, amenities F.
- Flagler (rural): math 53% / reading 56% proficiency, ranked #20 of 73 in FL (top 27%) — acceptable for families but not a draw, mixed tenant base, ~2y average lease.
- Zoned schools: Old Kings Elementary School (math 74% / reading 72%, grade A, #271 of 2,144 statewide, top 13%, 979 students, 52% FRL); Buddy Taylor Middle School (math 50% / reading 45%, grade C-, #288 of 571 statewide, top 51%, 1,343 students, 63% FRL); Flagler-Palm Coast High School (math 36% / reading 51%, grade F, #248 of 667 statewide, top 38%, 2,523 students, 52% FRL).
- Watch-outs: flood insurance adds $66/mo.
- Market conditions: 336 active listings in the ZIP; 2 comparable units currently listed for rent nearby; solid renter incomes; 2,588 units permitted in Flagler County in 2024 (0 in 5+ unit buildings).
- Flagler County population projected at +28% by 2050 — long-run rental-demand tailwind backs the buy-and-hold thesis.
- 4 sale attempts since 3y ago with the ask held roughly flat each time — persistent listings suggest the price (not the market) is what's stuck; bring a comps-based counter.
- Climate carrying-cost: severe flood risk; severe wind risk, 99% chance of damaging wind over 30y; extreme-heat days projected 7→22/yr by 2055 (HVAC capex compounding) — expect insurance premiums to compound above CPI over the hold.
- Cap rate 7.7% vs local median 1.7% in Beverly Beach — top-decile yield for the area; either an underpriced asset or a hidden risk that comps aren't pricing in. Stress-test before assuming the spread holds.
- This rent runs 38% of the median local income ($79k/yr) — at the standard rent-burdened threshold; future hikes will face affordability resistance.
Questions for listing agent
- It's been on market 71 days. Have you received any prior offers? Is the seller open to a 6% concession, seller financing, or rate buy-down credit?
- What's the actual annual flood-insurance premium (NFIP or private), and is the property in a SFHA with mandatory coverage?
- What does the HOA fee cover, when was the last increase, and are there any pending special assessments or reserve-fund shortfalls?
- Any open or pending special assessments — roof, HVAC, plumbing, elevator, façade? What's the per-unit balance and payoff schedule, and is the seller paying it off at close or rolling it to the buyer?
- Why hasn't it sold? Are there any deal-killer items the seller is aware of (foundation, flood, title, zoning, code violations)?
- Is there a deadline driving the sale (1031 exchange, divorce, estate, relocation)? That informs how much negotiation room exists.
- Schools are F-rated, which usually means shorter tenancies and higher turnover. Who's the typical renter profile here, and what's been the actual vacancy rate?
- What's the average days-on-market for RENTAL listings here right now (not sales)? A rising rental-DOM trend means longer vacancies and softer asking-rent achievability than the comps imply.
CashFlowRE · CFR-PBA7MRB88AHGYN
· Data 21 h ago
cashflowre.app · 2026-05-29