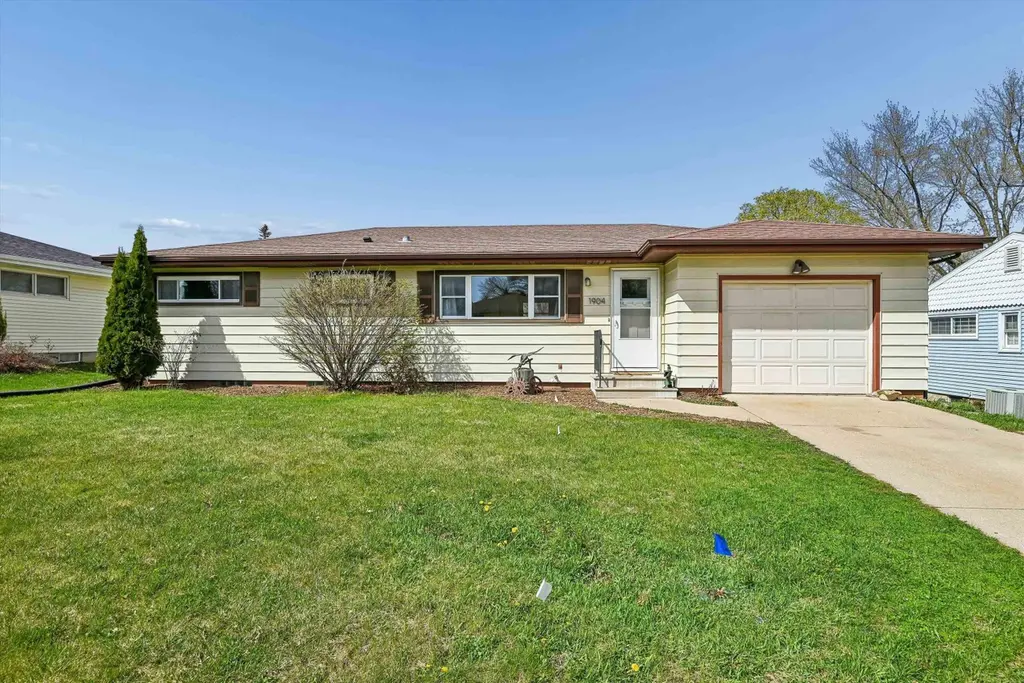
1904 NW 2nd Ave
Waverly, IA 50677
$214,900D
4 bd · 1.5 ba ·
1,600 sqft ·
Built 1958
· SingleFamily
· Pending
· 5 DOM
Cashflow @ list (25.0% down · 7.5%)
Estimated rent
$1,730/mo
Mortgage (P&I)
−$1,127
Tax + insurance
−$312
HOA
−$0
Vac / Maint / Mgmt
−$363
Net cashflow
$-73/mo
Annual
$-872/yr
Cap rate
5.89%
Cash-on-cash
-1.45%
DSCR
0.94
1% rule
0.81%
Cash to close
$60,172
Investor read
- This is a 4-bed/1.5-bath single-family listed at $215k.
- At list price, monthly cash flow is $-73 ($-872/yr) — negative.
- To cash-flow at today's rent, offer at most $202k (6.0% below list).
- To meet the 1% rule (rent ≥ 1% of price), the offer needs to be $173k (19.5% below list).
- Only 5 days on market — expect competitive offers; lowballing is unlikely to land.
- Recommended offer: $173k (19.5% below list) — sets the bar for 1% rule.
- Local home prices are declining (-3.0%/yr); year-one equity from $1k of loan paydown is wiped out by about $6k of value loss. Plan a longer hold.
- Location reads 86/100 on livability (#12 in IA, #406 nationally) — a professional / high-income tenant draw. Strengths: cost of living A+, housing A+, health & safety A+; Watch: amenities C-, commute F.
- Waverly-Shell Rock Community School District (town): math 79% / reading 74% proficiency, ranked #46 of 289 in IA (top 16%) — strong family-tenant draw, lease renewals of 3-5y typical; only 17% free/reduced lunch — higher-income household profile.
- Zoned schools: Waverly-Shell Rock Middle School (math 79% / reading 73%, grade A, #59 of 246 statewide, top 26%, 699 students, 22% FRL); Waverly-Shell Rock Senior High School (math 79% / reading 78%, grade A-, #50 of 336 statewide, top 15%, 771 students, 20% FRL) — zoned schools at 21% FRL track the district average.
- Watch-outs: built in 1958 — expect roof / HVAC / electrical / plumbing capex.
- Market conditions: 126 active listings in the ZIP; 1 comparable units currently listed for rent nearby; 34 units permitted in Bremer County in 2024 (0 in 5+ unit buildings).
- Bremer County population projected at +4% by 2050 — modest demand growth; plan on rents tracking national, not racing it.
- 3 sale attempts since 6y ago with the ask held roughly flat each time — persistent listings suggest the price (not the market) is what's stuck; bring a comps-based counter.
- Current owner paid $165k; 30% above their basis — modest negotiation headroom, anchor on the comps not their cost.
- Cap rate 5.9% vs local median 2.4% in Waverly — top-decile yield for the area; either an underpriced asset or a hidden risk that comps aren't pricing in. Stress-test before assuming the spread holds.
Questions for listing agent
- What do current leases actually rent for vs. the listed asking? Can we see a recent rent roll and the last 12 months of T-12 income?
- Built in 1958 — when were the roof, HVAC, electrical panel, plumbing, and water heater last replaced?
- Is there a deadline driving the sale (1031 exchange, divorce, estate, relocation)? That informs how much negotiation room exists.
- Schools are A-rated — typically a magnet for longer-tenancy family renters. What's the average tenant stay here, and is there a school-zone premium baked into asking?
- The area grade is low — what's the realistic commute time and amenity access for the typical tenant pool here? Any planned neighborhood developments (good or bad) we should know about?
- What's the average days-on-market for RENTAL listings here right now (not sales)? A rising rental-DOM trend means longer vacancies and softer asking-rent achievability than the comps imply.
- What's the recent tenant-quality profile in this submarket — average credit score on applications, eviction rate, late-payment / NSF rate, and stable-employment percentage? A property-management company in the area should have these aggregated.
- How much new for-sale + rental construction is in the pipeline within 1–3 miles? Heavy new supply typically softens prices + rents 12–24 months out; constrained supply supports both.
CashFlowRE · CFR-PBC9WQ5QB9CV9M
· Data 3 weeks ago
cashflowre.app · 2026-05-29