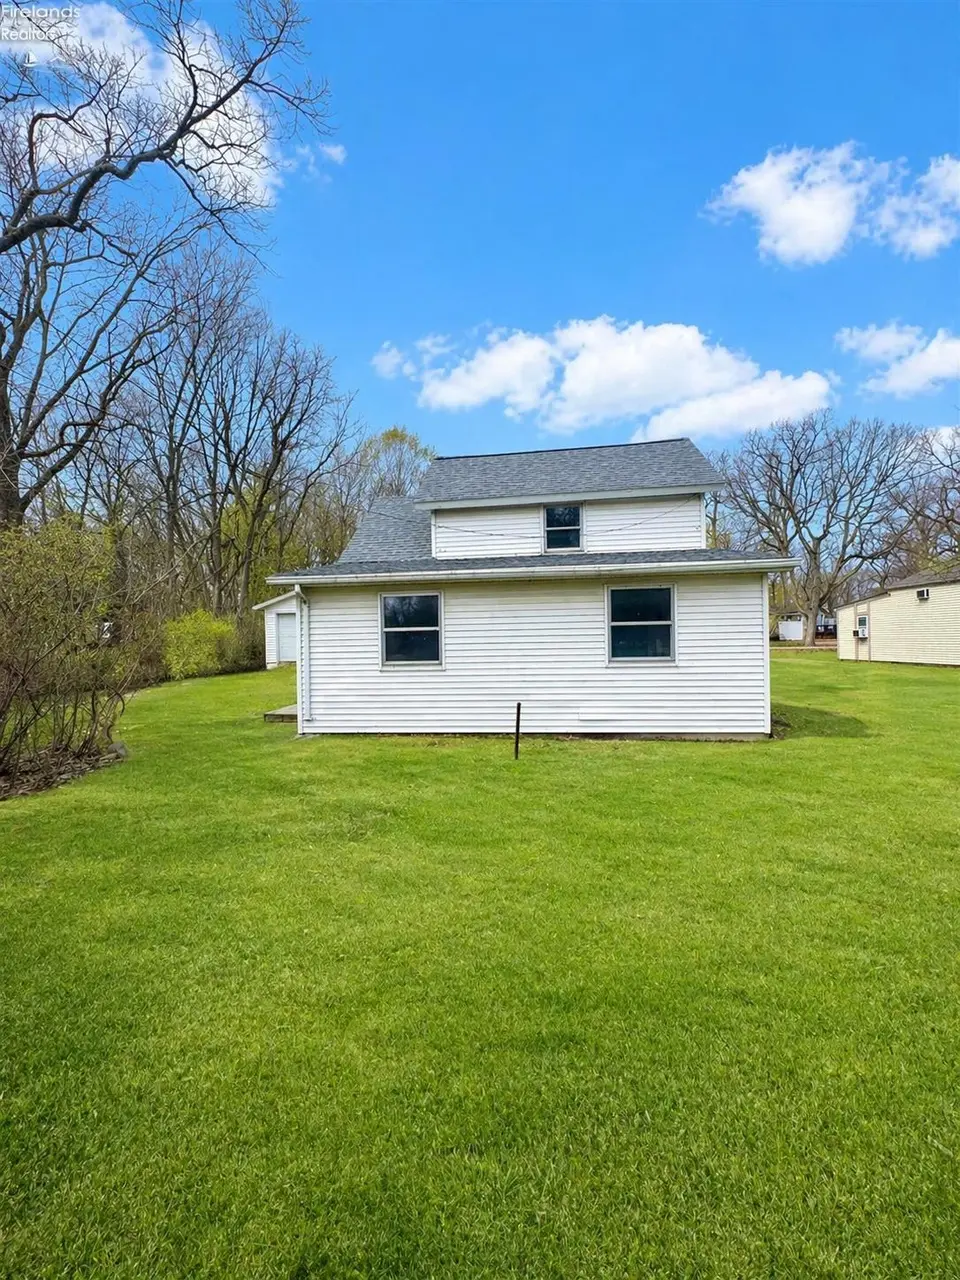
1778 NW Catawba Rd
Port Clinton, OH 43452
$199,000B-
2 bd · 1.0 ba ·
1,509 sqft ·
Built 1945
· SingleFamily
· Active
· 56 DOM
Cashflow @ list (25.0% down · 7.5%)
Estimated rent
$2,409/mo
Mortgage (P&I)
−$1,044
Tax + insurance
−$191
HOA
−$0
Vac / Maint / Mgmt
−$506
Net cashflow
$669/mo
Annual
$8,027/yr
Cap rate
10.33%
Cash-on-cash
14.41%
DSCR
1.64
1% rule
1.21%
Cash to close
$55,720
Investor read
- This is a 2-bed/1.0-bath single-family listed at $199k.
- At list price, monthly cash flow is $669 ($8k/yr) — positive.
- The deal already cash-flows at list — no discount required.
- Meets the 1% rule at list price ($2k rent vs $199k).
- It's been on market 56 days — a 3% lower offer ($193k) is reasonable based on typical stale-listing flexibility.
- Recommended offer: $193k (3.0% below list) — sets the bar for market timing.
- Local home prices are declining (-3.0%/yr); year-one equity from $1k of loan paydown is wiped out by about $6k of value loss. Plan a longer hold.
- Location reads 72/100 on livability (#359 in OH) — a middle-class / working-renter tenant base. Strengths: cost of living A+, housing A+, schools A-; Watch: employment C-, amenities F, commute F.
- Port Clinton City (town): math 55% / reading 59% proficiency, ranked #342 of 656 in OH (top 52%) — acceptable for families but not a draw, mixed tenant base, ~2y average lease.
- Watch-outs: built in 1945 — expect roof / HVAC / electrical / plumbing capex.
- Market conditions: 220 active listings in the ZIP; 128 units permitted in Ottawa County in 2024 (0 in 5+ unit buildings).
- Ottawa County population projected at -19% by 2050 — secular population decline; favor cash flow + early exit over multi-decade hold.
- Current owner paid $45k; list at $199k implies a 342% gain — meaningful room to come down on a strong offer.
- At projected returns (-3.0% appreciation + 3.0% rent growth), your $56k cash investment doubles in ~9 years — after that, you're playing with house money.
- Cap rate 10.3% vs local median 2.3% in Port Clinton — top-decile yield for the area; either an underpriced asset or a hidden risk that comps aren't pricing in. Stress-test before assuming the spread holds.
- At $2,409/mo this rent would consume 45% of the median local household income ($64k/yr) — very limited rent-growth headroom before tenants either downsize or default.
Questions for listing agent
- It's been on market 56 days. Have you received any prior offers? Is the seller open to a 3% concession, seller financing, or rate buy-down credit?
- Built in 1945 — when were the roof, HVAC, electrical panel, plumbing, and water heater last replaced?
- Is there a deadline driving the sale (1031 exchange, divorce, estate, relocation)? That informs how much negotiation room exists.
- Schools are A-rated — typically a magnet for longer-tenancy family renters. What's the average tenant stay here, and is there a school-zone premium baked into asking?
- What's the average days-on-market for RENTAL listings here right now (not sales)? A rising rental-DOM trend means longer vacancies and softer asking-rent achievability than the comps imply.
- What's the recent tenant-quality profile in this submarket — average credit score on applications, eviction rate, late-payment / NSF rate, and stable-employment percentage? A property-management company in the area should have these aggregated.
- How much new for-sale + rental construction is in the pipeline within 1–3 miles? Heavy new supply typically softens prices + rents 12–24 months out; constrained supply supports both.
CashFlowRE · CFR-PBF172522PDK4A
· Data 2 days ago
cashflowre.app · 2026-05-29