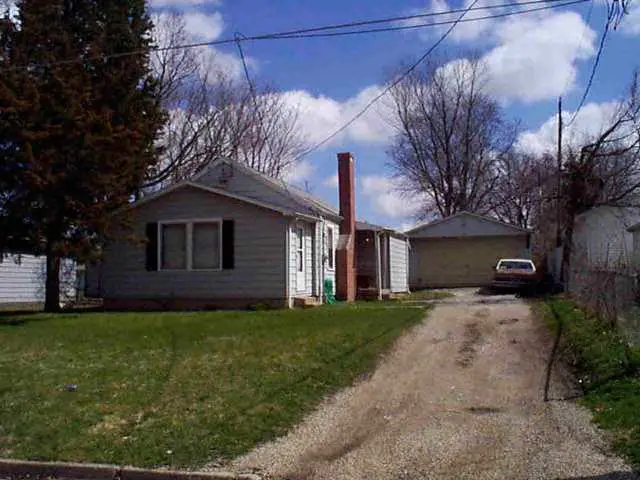
604 S Western Ave
Bloomington, IL 61701
$125,000C-
3 bd · 1.0 ba ·
708 sqft ·
Built 1925
· Other
· Active
· 6 DOM
Cashflow @ list (25.0% down · 7.5%)
Estimated rent
$1,326/mo
Mortgage (P&I)
−$656
Tax + insurance
−$197
HOA
−$0
Vac / Maint / Mgmt
−$279
Net cashflow
$195/mo
Annual
$2,345/yr
Cap rate
8.17%
Cash-on-cash
6.70%
DSCR
1.30
1% rule
1.06%
Cash to close
$35,000
Investor read
- This is a 3-bed/1.0-bath other listed at $125k.
- At list price, monthly cash flow is $195 ($2k/yr) — positive.
- The deal already cash-flows at list — no discount required.
- Meets the 1% rule at list price ($1k rent vs $125k).
- Only 6 days on market — expect competitive offers; lowballing is unlikely to land.
- Local home prices are declining (-3.0%/yr); year-one equity from $864 of loan paydown is wiped out by about $4k of value loss. Plan a longer hold.
- Location reads 77/100 on livability (#161 in IL, #2,987 nationally) — a middle-class / working-renter tenant base. Strengths: cost of living A+, housing A+, health & safety A+; Watch: amenities C-, commute F.
- Bloomington SD 87 (urban): math 14% / reading 19% proficiency, ranked #476 of 620 in IL (top 77%) — low school quality limits family demand, transient renter base, plan for 1-2y turnover.
- Zoned schools: Irving Elementary School (math 2% / reading 12%, grade F, #1,673 of 2,056 statewide, top 84%, 342 students, 0% FRL); Bloomington Jr High School (math 12% / reading 19%, grade F, #493 of 665 statewide, top 75%, 1,006 students, 0% FRL); Bloomington High School (math 27% / reading 33%, grade F, #179 of 693 statewide, top 27%, 1,503 students, 0% FRL) — zoned schools average 0% FRL vs 51% district-wide (51 pts lower); this property's tenant base skews higher-income than the district average.
- Watch-outs: built in 1925 — expect roof / HVAC / electrical / plumbing capex.
- Market conditions: Rents rising fast (+5.6%/yr); 88 active listings in the ZIP; 1 comparable units currently listed for rent nearby; 247 units permitted in McLean County in 2024 (54 in 5+ unit buildings).
- 2 sale attempts since 10y ago with the ask held roughly flat each time — persistent listings suggest the price (not the market) is what's stuck; bring a comps-based counter.
- Current owner paid $19k; list at $125k implies a 554% gain — meaningful room to come down on a strong offer.
- At projected returns (-3.0% appreciation + 5.6% rent growth), your $35k cash investment doubles in ~10 years — after that, you're playing with house money.
- Cap rate 8.2% vs local median 5.4% in Bloomington — top-decile yield for the area; either an underpriced asset or a hidden risk that comps aren't pricing in. Stress-test before assuming the spread holds.
Questions for listing agent
- Built in 1925 — when were the roof, HVAC, electrical panel, plumbing, and water heater last replaced?
- Is there a deadline driving the sale (1031 exchange, divorce, estate, relocation)? That informs how much negotiation room exists.
- What's the average days-on-market for RENTAL listings here right now (not sales)? A rising rental-DOM trend means longer vacancies and softer asking-rent achievability than the comps imply.
- What's the recent tenant-quality profile in this submarket — average credit score on applications, eviction rate, late-payment / NSF rate, and stable-employment percentage? A property-management company in the area should have these aggregated.
- How much new for-sale + rental construction is in the pipeline within 1–3 miles? Heavy new supply typically softens prices + rents 12–24 months out; constrained supply supports both.
CashFlowRE · CFR-PBNKRM293WV63E
· Data 1 day ago
cashflowre.app · 2026-05-29