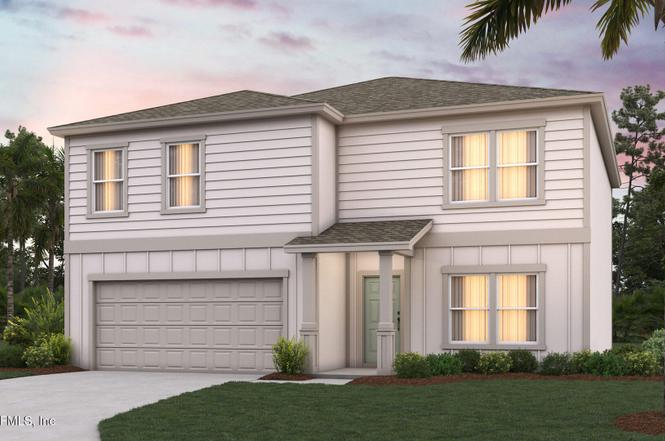
4319 Audubon Ave
Green Cove Springs, FL 32043
$406,950F
5 bd · 3.0 ba ·
2,499 sqft ·
Built 2026
· Land
· Pending
· 47 DOM
Cashflow @ list (25.0% down · 7.5%)
Estimated rent
$2,504/mo
Mortgage (P&I)
−$2,134
Tax + insurance
−$436
HOA
−$8
Vac / Maint / Mgmt
−$526
Net cashflow
$-601/mo
Annual
$-7,207/yr
Cap rate
4.52%
Cash-on-cash
-6.32%
DSCR
0.72
1% rule
0.62%
Cash to close
$113,946
Investor read
- This is a 5-bed/3.0-bath land listed at $407k.
- At list price, monthly cash flow is $-601 ($-7k/yr) — negative.
- To cash-flow at today's rent, offer at most $301k (26.1% below list).
- To meet the 1% rule (rent ≥ 1% of price), the offer needs to be $250k (38.5% below list).
- It's been on market 47 days — a 3% lower offer ($395k) is reasonable based on typical stale-listing flexibility.
- Recommended offer: $250k (38.5% below list) — sets the bar for 1% rule.
- Local home prices are declining (-3.0%/yr); year-one equity from $3k of loan paydown is wiped out by about $12k of value loss. Plan a longer hold.
- Location reads 75/100 on livability (#245 in FL, #3,868 nationally) — a middle-class / working-renter tenant base. Strengths: cost of living A+, housing A+, health & safety A+; Watch: amenities F, commute F.
- Clay (suburban): math 58% / reading 59% proficiency, ranked #14 of 73 in FL (top 19%) — acceptable for families but not a draw, mixed tenant base, ~2y average lease.
- Zoned schools: Charles E. Bennett Elementary School (math 41% / reading 39%, grade F, #1,491 of 2,144 statewide, top 70%, 624 students, 100% FRL); Green Cove Springs Junior High School (math 63% / reading 60%, grade B+, #124 of 571 statewide, top 22%, 799 students, 38% FRL); Clay High School (math 37% / reading 53%, grade D-, #228 of 667 statewide, top 35%, 1,666 students, 43% FRL) — zoned schools average 60% FRL vs 35% district-wide (25 pts higher); higher-poverty schools than district average — tighter screening recommended.
- Market conditions: Rents flat; 885 active listings in the ZIP; solid renter incomes; 1,876 units permitted in Clay County in 2024 (14 in 5+ unit buildings).
- Clay County population projected at +19% by 2050 — long-run rental-demand tailwind backs the buy-and-hold thesis.
- This rent runs 36% of the median local income ($84k/yr) — at the standard rent-burdened threshold; future hikes will face affordability resistance.
Questions for listing agent
- What do current leases actually rent for vs. the listed asking? Can we see a recent rent roll and the last 12 months of T-12 income?
- It's been on market 47 days. Have you received any prior offers? Is the seller open to a 38% concession, seller financing, or rate buy-down credit?
- What does the HOA fee cover, when was the last increase, and are there any pending special assessments or reserve-fund shortfalls?
- Is there a deadline driving the sale (1031 exchange, divorce, estate, relocation)? That informs how much negotiation room exists.
- The area grade is low — what's the realistic commute time and amenity access for the typical tenant pool here? Any planned neighborhood developments (good or bad) we should know about?
- What's the average days-on-market for RENTAL listings here right now (not sales)? A rising rental-DOM trend means longer vacancies and softer asking-rent achievability than the comps imply.
- What's the recent tenant-quality profile in this submarket — average credit score on applications, eviction rate, late-payment / NSF rate, and stable-employment percentage? A property-management company in the area should have these aggregated.
- How much new for-sale + rental construction is in the pipeline within 1–3 miles? Heavy new supply typically softens prices + rents 12–24 months out; constrained supply supports both.
CashFlowRE · CFR-PBZBFA5C0TM22J
· Data 3 weeks ago
cashflowre.app · 2026-05-29