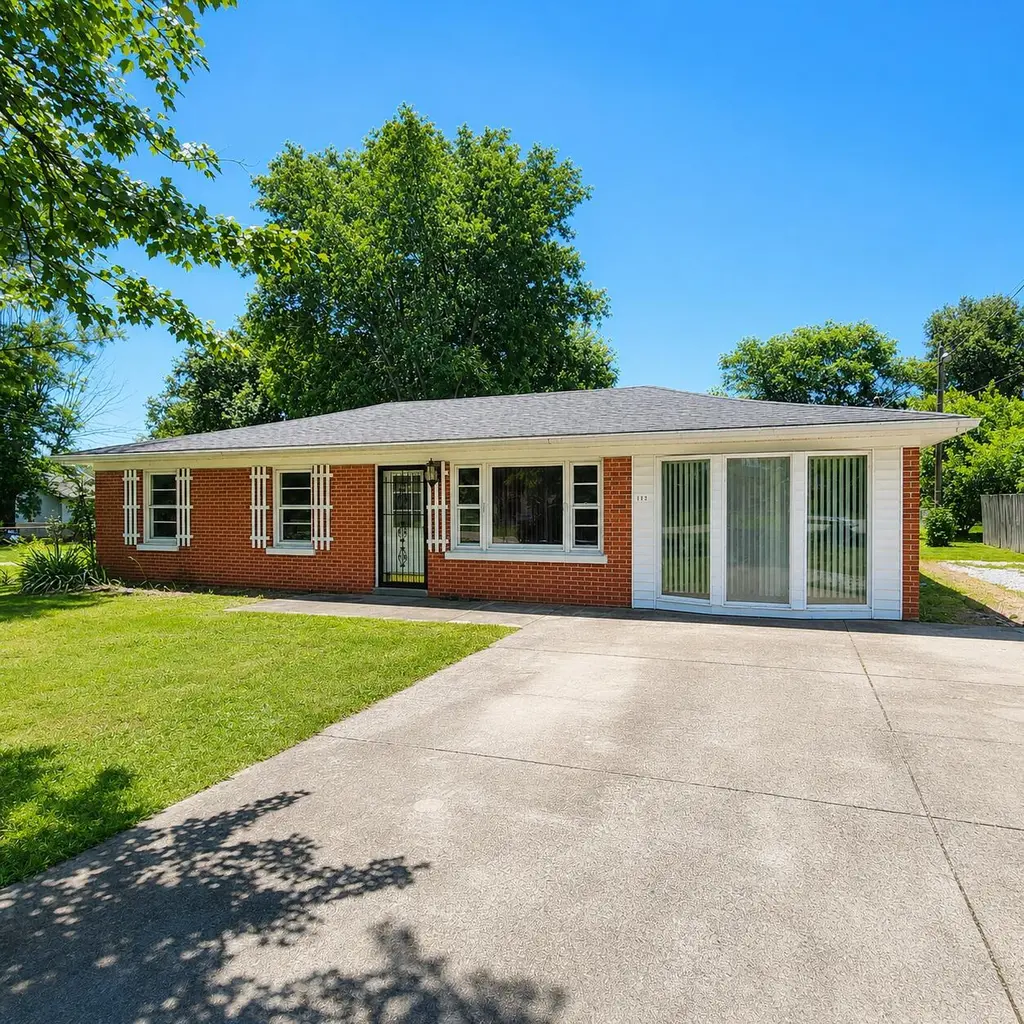
102 Bradley Dr
Richmond, KY 40475
$185,000C-
3 bd · 1.0 ba ·
1,536 sqft ·
Built 1991
· Other
· Pending
· 12 DOM
Cashflow @ list (25.0% down · 7.5%)
Estimated rent
$1,702/mo
Mortgage (P&I)
−$970
Tax + insurance
−$156
HOA
−$0
Vac / Maint / Mgmt
−$357
Net cashflow
$219/mo
Annual
$2,628/yr
Cap rate
7.71%
Cash-on-cash
5.07%
DSCR
1.23
1% rule
0.92%
Cash to close
$51,800
Investor read
- This is a 3-bed/1.0-bath other listed at $185k.
- At list price, monthly cash flow is $219 ($3k/yr) — positive.
- The deal already cash-flows at list — no discount required.
- To meet the 1% rule (rent ≥ 1% of price), the offer needs to be $170k (8.0% below list).
- Only 12 days on market — expect competitive offers; lowballing is unlikely to land.
- Recommended offer: $170k (8.0% below list) — sets the bar for 1% rule.
- Local home prices are declining (-3.0%/yr); year-one equity from $1k of loan paydown is wiped out by about $6k of value loss. Plan a longer hold.
- Location reads 69/100 on livability (#163 in KY) — a middle-class / working-renter tenant base. Strengths: cost of living A+, health & safety A+, housing A; Watch: amenities F, commute F, employment F.
- Madison County (town): math 31% / reading 47% proficiency, ranked #35 of 165 in KY (top 21%) — families likely to look elsewhere, expect single-tenant / working-renter base with shorter leases.
- Zoned schools: Waco Elementary School (math 22% / reading 32%, grade F, #434 of 676 statewide, top 69%, 428 students, 57% FRL); Clark Moores Middle School (math 16% / reading 47%, grade F, #125 of 217 statewide, top 63%, 546 students, 60% FRL); Madison Central High School (math 29% / reading 44%, grade F, #70 of 254 statewide, top 27%, 2,226 students, 47% FRL).
- Market conditions: Rents rising (+2.8%/yr); 487 active listings in the ZIP; 2 comparable units currently listed for rent nearby; 453 units permitted in Madison County in 2024 (64 in 5+ unit buildings).
- Madison County population projected at +28% by 2050 — long-run rental-demand tailwind backs the buy-and-hold thesis.
- Climate carrying-cost: moderate wildfire risk — expect insurance premiums to compound above CPI over the hold.
- Cap rate 7.7% vs local median 3.1% in Richmond — top-decile yield for the area; either an underpriced asset or a hidden risk that comps aren't pricing in. Stress-test before assuming the spread holds.
- This rent runs 32% of the median local income ($63k/yr) — at the standard rent-burdened threshold; future hikes will face affordability resistance.
Questions for listing agent
- Is there a deadline driving the sale (1031 exchange, divorce, estate, relocation)? That informs how much negotiation room exists.
- Schools are D-rated, which usually means shorter tenancies and higher turnover. Who's the typical renter profile here, and what's been the actual vacancy rate?
- What's the average days-on-market for RENTAL listings here right now (not sales)? A rising rental-DOM trend means longer vacancies and softer asking-rent achievability than the comps imply.
- What's the recent tenant-quality profile in this submarket — average credit score on applications, eviction rate, late-payment / NSF rate, and stable-employment percentage? A property-management company in the area should have these aggregated.
- How much new for-sale + rental construction is in the pipeline within 1–3 miles? Heavy new supply typically softens prices + rents 12–24 months out; constrained supply supports both.
CashFlowRE · CFR-PCACS281R363X2
· Data 4 days ago
cashflowre.app · 2026-05-29