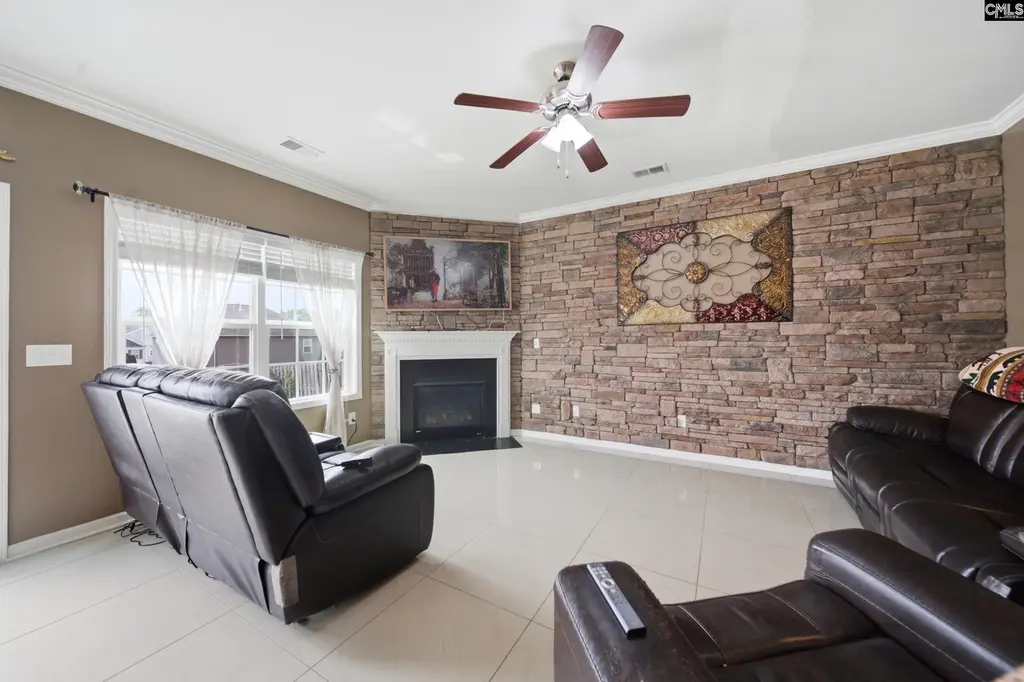
543 Walking Ln
White Knoll, SC 29073
$305,000D-
4 bd · 2.5 ba ·
2,058 sqft ·
Built 2018
· SingleFamily
· Active
· 47 DOM
Cashflow @ list (25.0% down · 7.5%)
Estimated rent
$2,292/mo
Mortgage (P&I)
−$1,599
Tax + insurance
−$225
HOA
−$31
Vac / Maint / Mgmt
−$481
Net cashflow
$-46/mo
Annual
$-547/yr
Cap rate
6.11%
Cash-on-cash
-0.64%
DSCR
0.97
1% rule
0.75%
Cash to close
$85,400
Investor read
- This is a 4-bed/2.5-bath single-family listed at $305k.
- At list price, monthly cash flow is $-46 ($-547/yr) — negative.
- To cash-flow at today's rent, offer at most $297k (2.6% below list).
- To meet the 1% rule (rent ≥ 1% of price), the offer needs to be $229k (24.9% below list).
- It's been on market 47 days — a 3% lower offer ($296k) is reasonable based on typical stale-listing flexibility.
- Recommended offer: $229k (24.9% below list) — sets the bar for 1% rule.
- Local home prices are declining (-3.0%/yr); year-one equity from $2k of loan paydown is wiped out by about $9k of value loss. Plan a longer hold.
- Location reads: area grade D — affects rentability + tenant quality, not the cash-flow math above.
- Lexington 01 (suburban): math 42% / reading 53% proficiency, ranked #11 of 80 in SC (top 14%) — families likely to look elsewhere, expect single-tenant / working-renter base with shorter leases.
- Zoned schools: Carolina Springs Elementary (math 34% / reading 34%, grade F, #359 of 597 statewide, top 60%, 850 students, 41% FRL); White Knoll High (math 47% / reading 85%, grade B, #81 of 196 statewide, top 42%, 2,204 students, 45% FRL).
- Market conditions: Rents rising (+3.2%/yr); 564 active listings in the ZIP; 5 comparable units currently listed for rent nearby; rentals at typical pace (median 21d on market — plan ~3-4 weeks tenant-placement turnaround); solid renter incomes; 1,712 units permitted in Lexington County in 2024 (0 in 5+ unit buildings).
- Lexington County population projected at +26% by 2050 — long-run rental-demand tailwind backs the buy-and-hold thesis.
- 3 sale attempts since 3y ago with the ask held roughly flat each time — persistent listings suggest the price (not the market) is what's stuck; bring a comps-based counter.
- Climate carrying-cost: major wind risk, 67% chance of damaging wind over 30y; moderate wildfire risk; extreme-heat days projected 7→16/yr by 2055 (HVAC capex compounding) — expect insurance premiums to compound above CPI over the hold.
- This rent runs 36% of the median local income ($77k/yr) — at the standard rent-burdened threshold; future hikes will face affordability resistance.
Questions for listing agent
- What do current leases actually rent for vs. the listed asking? Can we see a recent rent roll and the last 12 months of T-12 income?
- It's been on market 47 days. Have you received any prior offers? Is the seller open to a 25% concession, seller financing, or rate buy-down credit?
- What does the HOA fee cover, when was the last increase, and are there any pending special assessments or reserve-fund shortfalls?
- Is there a deadline driving the sale (1031 exchange, divorce, estate, relocation)? That informs how much negotiation room exists.
- The area grade is low — what's the realistic commute time and amenity access for the typical tenant pool here? Any planned neighborhood developments (good or bad) we should know about?
- What's the average days-on-market for RENTAL listings here right now (not sales)? A rising rental-DOM trend means longer vacancies and softer asking-rent achievability than the comps imply.
- What's the recent tenant-quality profile in this submarket — average credit score on applications, eviction rate, late-payment / NSF rate, and stable-employment percentage? A property-management company in the area should have these aggregated.
- How much new for-sale + rental construction is in the pipeline within 1–3 miles? Heavy new supply typically softens prices + rents 12–24 months out; constrained supply supports both.
CashFlowRE · CFR-PCMM34269JHX3K
· Data 2 days ago
cashflowre.app · 2026-05-29