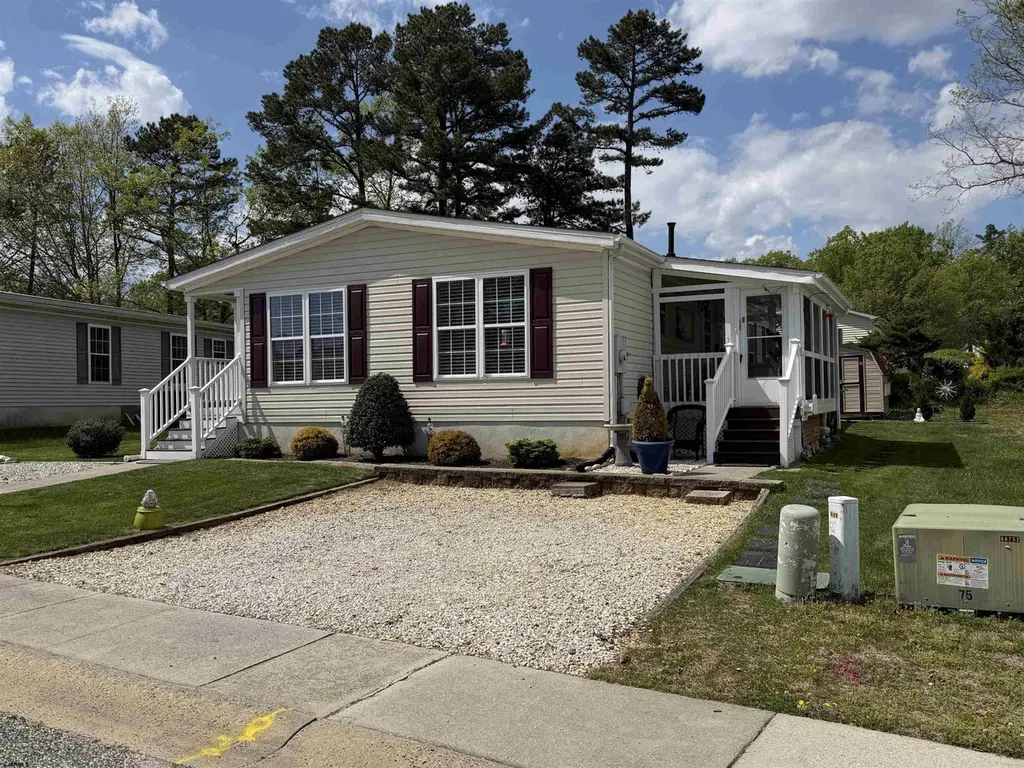
16 Dogwood Ln
Estell Manor, NJ 08330
$223,000D+
2 bd · 2.0 ba ·
1,400 sqft ·
Built 2002
· Manufactured
· Pending
· 30 DOM
Cashflow @ list (25.0% down · 7.5%)
Estimated rent
$2,339/mo
Mortgage (P&I)
−$1,169
Tax + insurance
−$372
HOA
−$821
Vac / Maint / Mgmt
−$491
Net cashflow
$-514/mo
Annual
$-6,170/yr
Cap rate
3.53%
Cash-on-cash
-9.88%
DSCR
0.56
1% rule
1.05%
Cash to close
$62,440
Investor read
- This is a 2-bed/2.0-bath manufactured listed at $223k. Condition is rated good.
- At list price, monthly cash flow is $-514 ($-6k/yr) — negative.
- To cash-flow at today's rent, offer at most $149k (33.4% below list).
- Meets the 1% rule at list price ($2k rent vs $223k).
- It's been on market 30 days — a 2% lower offer ($220k) is reasonable based on typical stale-listing flexibility.
- Recommended offer: $149k (33.4% below list) — sets the bar for cash-flow.
- In year one you build about $24k of equity ($2k loan paydown + $22k appreciation (10.0% local appreciation)).
- Location reads 64/100 on livability (#414 in NJ) — a middle-class / working-renter tenant base. Strengths: crime A+, employment A+, housing A+; Watch: amenities F, commute F, cost of living F.
- Weymouth Township School District (rural): math 50% / reading 55% proficiency, ranked #351 of 612 in NJ (top 57%) — acceptable for families but not a draw, mixed tenant base, ~2y average lease.
- Zoned schools: Weymouth Township Elementary School (math 27% / reading 47%, grade F, #528 of 1,303 statewide, top 43%, 156 students, 45% FRL).
- Zoned-school proficiency averages 37% at this address vs 52% district-wide (-16 pts) — the specific schools serving this property underperform the Weymouth Township School District average; the district grade overstates school quality for this exact location.
- Watch-outs: HOA is 35% of rent.
- Market conditions: 244 active listings in the ZIP; solid renter incomes; 672 units permitted in Atlantic County in 2024 (258 in 5+ unit buildings).
- Atlantic County population projected at -12% by 2050 — secular population decline; favor cash flow + early exit over multi-decade hold.
- 4 sale attempts with the ask held roughly flat each time — persistent listings suggest the price (not the market) is what's stuck; bring a comps-based counter.
- By year 2, paydown + projected appreciation supports a ~$38k cash-out refi (75% LTV) — recoverable capital for the next deal without selling this one.
- This rent runs 36% of the median local income ($77k/yr) — at the standard rent-burdened threshold; future hikes will face affordability resistance.
Questions for listing agent
- What do current leases actually rent for vs. the listed asking? Can we see a recent rent roll and the last 12 months of T-12 income?
- What does the HOA fee cover, when was the last increase, and are there any pending special assessments or reserve-fund shortfalls?
- Is there a deadline driving the sale (1031 exchange, divorce, estate, relocation)? That informs how much negotiation room exists.
- The area grade is low — what's the realistic commute time and amenity access for the typical tenant pool here? Any planned neighborhood developments (good or bad) we should know about?
- What's the average days-on-market for RENTAL listings here right now (not sales)? A rising rental-DOM trend means longer vacancies and softer asking-rent achievability than the comps imply.
- What's the recent tenant-quality profile in this submarket — average credit score on applications, eviction rate, late-payment / NSF rate, and stable-employment percentage? A property-management company in the area should have these aggregated.
- How much new for-sale + rental construction is in the pipeline within 1–3 miles? Heavy new supply typically softens prices + rents 12–24 months out; constrained supply supports both.
CashFlowRE · CFR-PJM2TAB9GZD9W8
· Data 1 week ago
cashflowre.app · 2026-05-29