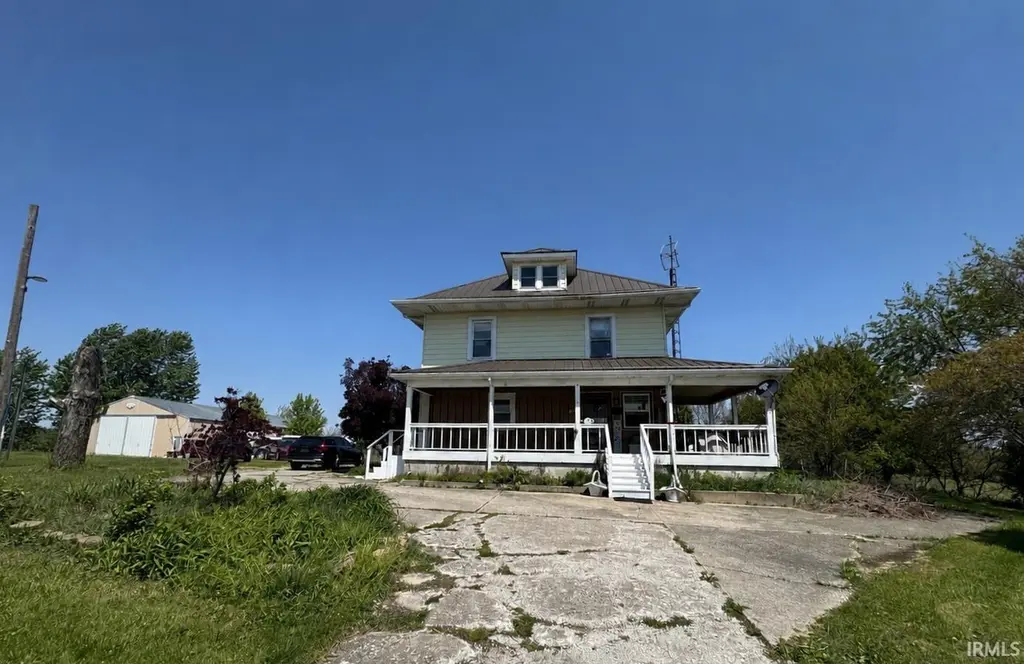
4691 E 550 N
Landess, IN 46952
$179,900F
3 bd · 1.0 ba ·
2,460 sqft ·
Built 1910
· SingleFamily
· Pending
· 11 DOM
Cashflow @ list (25.0% down · 7.5%)
Estimated rent
$1,224/mo
Mortgage (P&I)
−$943
Tax + insurance
−$194
HOA
−$0
Vac / Maint / Mgmt
−$257
Net cashflow
$-170/mo
Annual
$-2,043/yr
Cap rate
5.16%
Cash-on-cash
-4.06%
DSCR
0.82
1% rule
0.68%
Cash to close
$50,372
Investor read
- This is a 3-bed/1.0-bath single-family listed at $180k.
- At list price, monthly cash flow is $-170 ($-2k/yr) — negative.
- To cash-flow at today's rent, offer at most $150k (16.7% below list).
- To meet the 1% rule (rent ≥ 1% of price), the offer needs to be $122k (32.0% below list).
- Only 11 days on market — expect competitive offers; lowballing is unlikely to land.
- Recommended offer: $122k (32.0% below list) — sets the bar for 1% rule.
- Local home prices are declining (-3.0%/yr); year-one equity from $1k of loan paydown is wiped out by about $5k of value loss. Plan a longer hold.
- Location reads 61/100 on livability (#499 in IN) — a middle-class / working-renter tenant base. Strengths: cost of living A+, crime A, employment A; Watch: health & safety C-, amenities F, commute F.
- Eastbrook Community School Corporation (rural): math 42% / reading 46% proficiency, ranked #98 of 301 in IN (top 33%) — families likely to look elsewhere, expect single-tenant / working-renter base with shorter leases.
- Zoned schools: Eastbrook North Elementary (math 43% / reading 34%, grade F, #535 of 994 statewide, top 54%, 307 students, 52% FRL); Eastbrook Middle School (math 30% / reading 45%, grade F, #146 of 330 statewide, top 46%, 399 students, 48% FRL); Eastbrook High School (math 52% / reading 72%, grade B-, #41 of 369 statewide, top 12%, 509 students, 38% FRL).
- Watch-outs: built in 1910 — expect roof / HVAC / electrical / plumbing capex.
- Market conditions: 127 active listings in the ZIP; 52 units permitted in Grant County in 2024 (8 in 5+ unit buildings).
- Grant County population projected at -18% by 2050 — secular population decline; favor cash flow + early exit over multi-decade hold.
Questions for listing agent
- What do current leases actually rent for vs. the listed asking? Can we see a recent rent roll and the last 12 months of T-12 income?
- Built in 1910 — when were the roof, HVAC, electrical panel, plumbing, and water heater last replaced?
- Is there a deadline driving the sale (1031 exchange, divorce, estate, relocation)? That informs how much negotiation room exists.
- Schools are D-rated, which usually means shorter tenancies and higher turnover. Who's the typical renter profile here, and what's been the actual vacancy rate?
- The area grade is low — what's the realistic commute time and amenity access for the typical tenant pool here? Any planned neighborhood developments (good or bad) we should know about?
- What's the average days-on-market for RENTAL listings here right now (not sales)? A rising rental-DOM trend means longer vacancies and softer asking-rent achievability than the comps imply.
- What's the recent tenant-quality profile in this submarket — average credit score on applications, eviction rate, late-payment / NSF rate, and stable-employment percentage? A property-management company in the area should have these aggregated.
- How much new for-sale + rental construction is in the pipeline within 1–3 miles? Heavy new supply typically softens prices + rents 12–24 months out; constrained supply supports both.
CashFlowRE · CFR-PKEJYV6PTTYED3
· Data 6 days ago
cashflowre.app · 2026-05-29