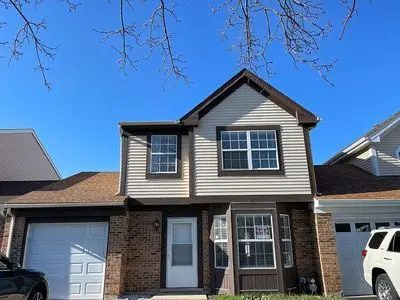
1295 Oriole Trl
Carol Stream, IL 60188
$334,900D-
3 bd · 2.0 ba ·
1,423 sqft ·
Built 1990
· SingleFamily
· Active
· 41 DOM
Cashflow @ list (25.0% down · 7.5%)
Estimated rent
$2,570/mo
Mortgage (P&I)
−$1,756
Tax + insurance
−$547
HOA
−$0
Vac / Maint / Mgmt
−$540
Net cashflow
$-272/mo
Annual
$-3,267/yr
Cap rate
5.32%
Cash-on-cash
-3.48%
DSCR
0.84
1% rule
0.77%
Cash to close
$93,772
Investor read
- This is a 3-bed/2.0-bath single-family listed at $335k.
- At list price, monthly cash flow is $-272 ($-3k/yr) — negative.
- To cash-flow at today's rent, offer at most $287k (14.4% below list).
- To meet the 1% rule (rent ≥ 1% of price), the offer needs to be $257k (23.2% below list).
- It's been on market 41 days — a 3% lower offer ($325k) is reasonable based on typical stale-listing flexibility.
- Recommended offer: $257k (23.2% below list) — sets the bar for 1% rule.
- Local home prices are declining (-3.0%/yr); year-one equity from $2k of loan paydown is wiped out by about $10k of value loss. Plan a longer hold.
- Location reads 80/100 on livability (#112 in IL, #1,808 nationally) — a professional / high-income tenant draw. Strengths: crime A+, commute A+, employment A+; Watch: amenities F, health & safety F.
- SD U-46 (suburban): math 19% / reading 20% proficiency, ranked #386 of 620 in IL (top 62%) — low school quality limits family demand, transient renter base, plan for 1-2y turnover.
- Zoned schools: Spring Trail Elementary School (math 37% / reading 32%, grade F, #517 of 2,056 statewide, top 28%, 430 students, 0% FRL); Eastview Middle School (math 33% / reading 36%, grade F, #201 of 665 statewide, top 31%, 725 students, 0% FRL); Bartlett High School (math 27% / reading 31%, grade F, #210 of 693 statewide, top 30%, 2,122 students, 0% FRL) — zoned schools average 0% FRL vs 52% district-wide (52 pts lower); this property's tenant base skews higher-income than the district average.
- Zoned-school proficiency averages 33% at this address vs 20% district-wide (+13 pts) — the actual schools serving this property are materially stronger than the SD U-46 average implies; a family-tenant draw the district grade alone would hide.
- Market conditions: Rents rising (+3.4%/yr); 60 active listings in the ZIP; 15 comparable units currently listed for rent nearby; rentals leasing fast (median 10d on market — plan ~1-2 weeks tenant-placement turnaround); solid renter incomes; 1,378 units permitted in DuPage County in 2024 (594 in 5+ unit buildings).
- Current owner paid $204k; list at $335k implies a 64% gain — meaningful room to come down on a strong offer.
- Cap rate 5.3% vs local median 3.7% in Carol Stream — top-decile yield for the area; either an underpriced asset or a hidden risk that comps aren't pricing in. Stress-test before assuming the spread holds.
Questions for listing agent
- What do current leases actually rent for vs. the listed asking? Can we see a recent rent roll and the last 12 months of T-12 income?
- It's been on market 41 days. Have you received any prior offers? Is the seller open to a 23% concession, seller financing, or rate buy-down credit?
- Is there a deadline driving the sale (1031 exchange, divorce, estate, relocation)? That informs how much negotiation room exists.
- The area grade is low — what's the realistic commute time and amenity access for the typical tenant pool here? Any planned neighborhood developments (good or bad) we should know about?
- What's the average days-on-market for RENTAL listings here right now (not sales)? A rising rental-DOM trend means longer vacancies and softer asking-rent achievability than the comps imply.
- What's the recent tenant-quality profile in this submarket — average credit score on applications, eviction rate, late-payment / NSF rate, and stable-employment percentage? A property-management company in the area should have these aggregated.
- How much new for-sale + rental construction is in the pipeline within 1–3 miles? Heavy new supply typically softens prices + rents 12–24 months out; constrained supply supports both.
CashFlowRE · CFR-PKF6R28G5EQ6GM
· Data 2 h ago
cashflowre.app · 2026-05-29