904 SE 3rd Ter
Lee's Summit, MO 64063
$349,900B+
8 bd · 7.0 ba ·
6,448 sqft ·
Built 1965
· MultiFamily
· Pending
· 1 DOM
Cashflow @ list (25.0% down · 7.5%)
Estimated rent
$4,698/mo
Mortgage (P&I)
−$1,835
Tax + insurance
−$639
HOA
−$0
Vac / Maint / Mgmt
−$987
Net cashflow
$1,238/mo
Annual
$14,854/yr
Cap rate
10.73%
Cash-on-cash
15.84%
DSCR
1.70
1% rule
1.34%
Cash to close
$97,972
Investor read
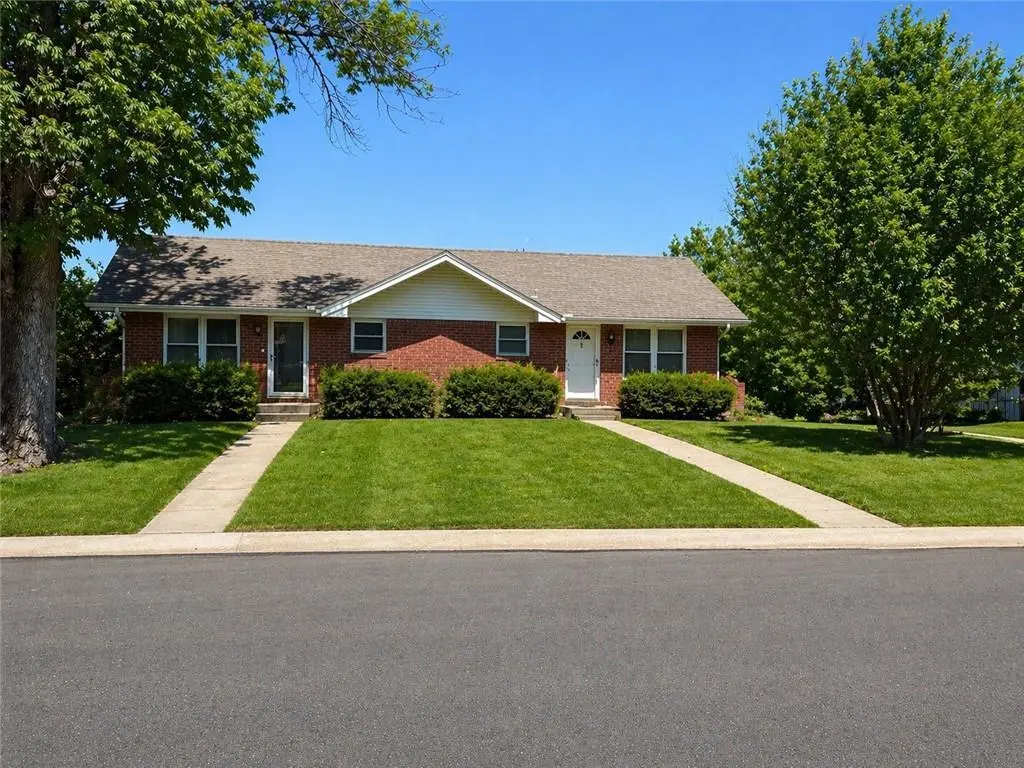
- This is a 2 × 4-bed/3.5-bath units multifamily listed at $350k. Condition is rated good.
- At list price, monthly cash flow is $1k ($15k/yr) — positive. Per door: $619/mo.
- The deal already cash-flows at list — no discount required.
- Meets the 1% rule at list price ($5k rent vs $350k).
- Only 1 days on market — expect competitive offers; lowballing is unlikely to land.
- Local home prices are declining (-3.0%/yr); year-one equity from $2k of loan paydown is wiped out by about $10k of value loss. Plan a longer hold.
- Location reads: area grade B — affects rentability + tenant quality, not the cash-flow math above.
- Lee'S Summit R-VII (suburban): math 46% / reading 55% proficiency, ranked #23 of 324 in MO (top 7%) — acceptable for families but not a draw, mixed tenant base, ~2y average lease; only 16% free/reduced lunch — higher-income household profile.
- Watch-outs: flood insurance adds $56/mo.
- Market conditions: Rents rising fast (+5.0%/yr); 103 active listings in the ZIP; solid renter incomes; 4,002 units permitted in Jackson County in 2024 (2,271 in 5+ unit buildings).
- Jackson County population projected at +4% by 2050 — modest demand growth; plan on rents tracking national, not racing it.
- 2 sale attempts since 19y ago; this cycle's ask is 100% above the opening price — seller raised mid-cycle; expect resistance to lowballs.
- At projected returns (-3.0% appreciation + 5.0% rent growth), your $98k cash investment doubles in ~7 years — after that, you're playing with house money.
- Climate carrying-cost: major flood risk — expect insurance premiums to compound above CPI over the hold.
- Cap rate 10.7% vs local median 2.6% in Lee's Summit — top-decile yield for the area; either an underpriced asset or a hidden risk that comps aren't pricing in. Stress-test before assuming the spread holds.
- At $4,698/mo this rent would consume 70% of the median local household income ($80k/yr) (locally 573% of renters already pay >50% of income on rent) — very limited rent-growth headroom before tenants either downsize or default.
Questions for listing agent
- Can we see the unit-by-unit rent roll, current vacancy, and any below-market leases? What's the average tenancy length?
- What capital expenditures (roof, boiler, parking lot, exteriors) have been made in the last 5 years, and what's planned in the next 2?
- Built in 1965 — when were the roof, HVAC, electrical panel, plumbing, and water heater last replaced?
- What's the actual annual flood-insurance premium (NFIP or private), and is the property in a SFHA with mandatory coverage?
- Is there a deadline driving the sale (1031 exchange, divorce, estate, relocation)? That informs how much negotiation room exists.
- What's the average days-on-market for RENTAL listings here right now (not sales)? A rising rental-DOM trend means longer vacancies and softer asking-rent achievability than the comps imply.
- What's the recent tenant-quality profile in this submarket — average credit score on applications, eviction rate, late-payment / NSF rate, and stable-employment percentage? A property-management company in the area should have these aggregated.
- How much new apartment / multifamily construction is in the pipeline within 1–3 miles? Heavy new supply (>2% of stock underway) typically softens rents 12–24 months out; light construction supports rent growth.
CashFlowRE · CFR-PMB567AVFTBED5
· Data 3 weeks ago
cashflowre.app · 2026-05-29