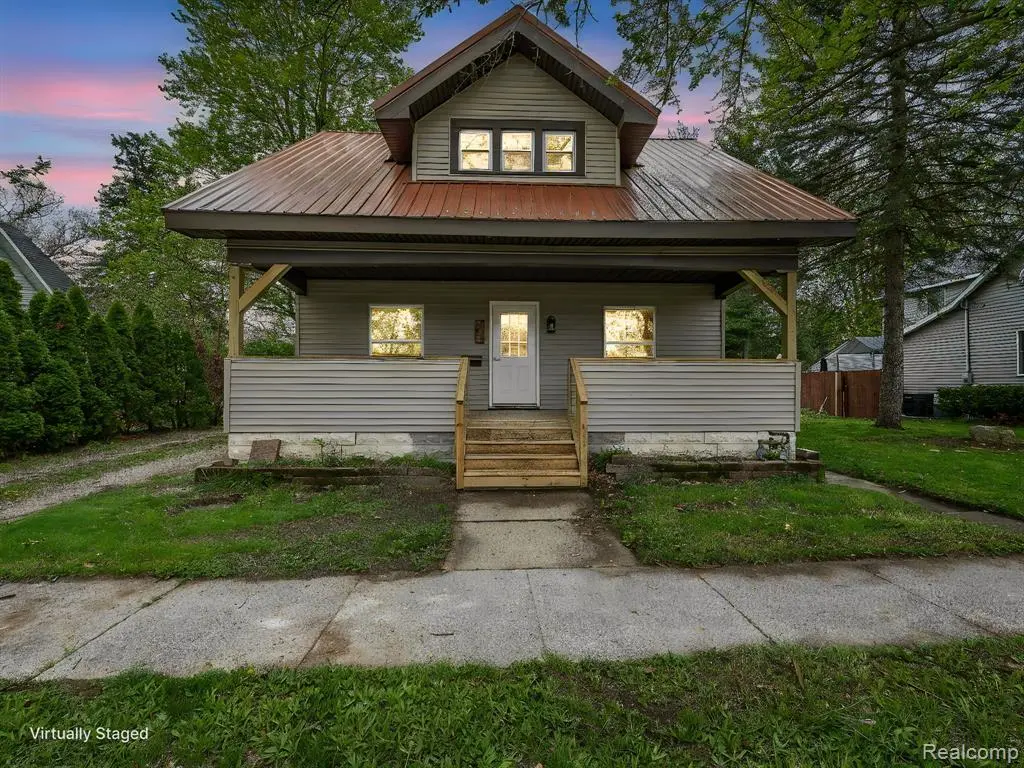
426 S East St
Morenci, MI 49256
$178,000F
3 bd · 1.0 ba ·
1,092 sqft ·
Built 1900
· SingleFamily
· Pending
· 32 DOM
Cashflow @ list (25.0% down · 7.5%)
Estimated rent
$794/mo
Mortgage (P&I)
−$933
Tax + insurance
−$150
HOA
−$0
Vac / Maint / Mgmt
−$167
Net cashflow
$-456/mo
Annual
$-5,471/yr
Cap rate
3.22%
Cash-on-cash
-10.98%
DSCR
0.51
1% rule
0.45%
Cash to close
$49,840
Investor read
- This is a 3-bed/1.0-bath single-family listed at $178k.
- At list price, monthly cash flow is $-456 ($-5k/yr) — negative.
- To cash-flow at today's rent, offer at most $97k (45.2% below list).
- To meet the 1% rule (rent ≥ 1% of price), the offer needs to be $79k (55.4% below list).
- It's been on market 32 days — a 3% lower offer ($173k) is reasonable based on typical stale-listing flexibility.
- Recommended offer: $79k (55.4% below list) — sets the bar for 1% rule.
- In year one you build about $19k of equity ($1k loan paydown + $18k appreciation (10.0% local appreciation)).
- Location reads 74/100 on livability (#167 in MI, #4,401 nationally) — a middle-class / working-renter tenant base. Strengths: crime A+, cost of living A+, health & safety A+; Watch: amenities F, commute F, employment F.
- Morenci Area Schools (rural): math 28% / reading 43% proficiency, ranked #283 of 540 in MI (top 52%) — families likely to look elsewhere, expect single-tenant / working-renter base with shorter leases.
- Zoned schools: Morenci Elementary School (math 32% / reading 37%, grade F, #744 of 1,397 statewide, top 57%, 243 students, 58% FRL); Morenci Middle And High School (math 27% / reading 47%, grade F, #334 of 713 statewide, top 51%, 289 students, 52% FRL).
- Watch-outs: built in 1900 — expect roof / HVAC / electrical / plumbing capex.
- Market conditions: 19 active listings in the ZIP; 2 comparable units currently listed for rent nearby; 137 units permitted in Lenawee County in 2024 (0 in 5+ unit buildings).
- Lenawee County population projected at -18% by 2050 — secular population decline; favor cash flow + early exit over multi-decade hold.
- 8 sale attempts since 17y ago with the ask held roughly flat each time — persistent listings suggest the price (not the market) is what's stuck; bring a comps-based counter.
- Current owner paid $59k; list at $178k implies a 200% gain — meaningful room to come down on a strong offer.
- By year 2, paydown + projected appreciation supports a ~$31k cash-out refi (75% LTV) — recoverable capital for the next deal without selling this one.
- This rent is only 16% of the median local income ($61k/yr) — well below the 30% rent-burden line; pricing power to push rent on renewal without tenant pushback.
Questions for listing agent
- What do current leases actually rent for vs. the listed asking? Can we see a recent rent roll and the last 12 months of T-12 income?
- It's been on market 32 days. Have you received any prior offers? Is the seller open to a 55% concession, seller financing, or rate buy-down credit?
- Built in 1900 — when were the roof, HVAC, electrical panel, plumbing, and water heater last replaced?
- Is there a deadline driving the sale (1031 exchange, divorce, estate, relocation)? That informs how much negotiation room exists.
- Schools are D-rated, which usually means shorter tenancies and higher turnover. Who's the typical renter profile here, and what's been the actual vacancy rate?
- The area grade is low — what's the realistic commute time and amenity access for the typical tenant pool here? Any planned neighborhood developments (good or bad) we should know about?
- What's the average days-on-market for RENTAL listings here right now (not sales)? A rising rental-DOM trend means longer vacancies and softer asking-rent achievability than the comps imply.
- What's the recent tenant-quality profile in this submarket — average credit score on applications, eviction rate, late-payment / NSF rate, and stable-employment percentage? A property-management company in the area should have these aggregated.
CashFlowRE · CFR-PNVX0F5WM1QMG8
· Data 3 weeks ago
cashflowre.app · 2026-05-29