165 Lattintown Rd #60
Marlboro, NY 12550
$94,000C
2 bd · 1.0 ba ·
924 sqft ·
Built 1980
· Manufactured
· Active
· 8 DOM
Cashflow @ list (25.0% down · 7.5%)
Estimated rent
$2,075/mo
Mortgage (P&I)
−$493
Tax + insurance
−$223
HOA
−$965
Vac / Maint / Mgmt
−$436
Net cashflow
$-42/mo
Annual
$-500/yr
Cap rate
6.61%
Cash-on-cash
1.13%
DSCR
1.05
1% rule
2.21%
Cash to close
$26,320
Investor read
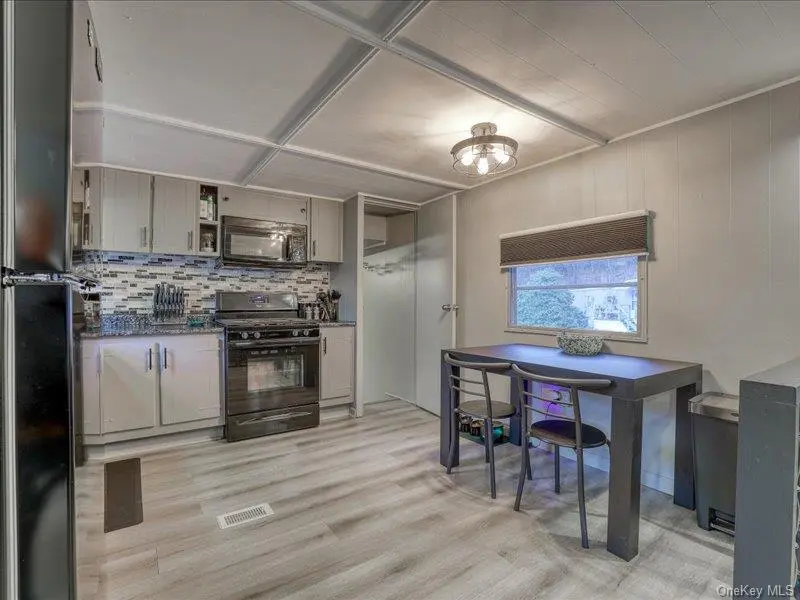
- This is a 2-bed/1.0-bath manufactured listed at $94k. Condition is rated good.
- At list price, monthly cash flow is $-42 ($-500/yr) — negative.
- To cash-flow at today's rent, offer at most $88k (6.4% below list).
- Meets the 1% rule at list price ($2k rent vs $94k).
- Only 8 days on market — expect competitive offers; lowballing is unlikely to land.
- Recommended offer: $88k (6.4% below list) — sets the bar for cash-flow.
- Local home prices are declining (-3.0%/yr); year-one equity from $650 of loan paydown is wiped out by about $3k of value loss. Plan a longer hold.
- Location reads 72/100 on livability (#347 in NY) — a middle-class / working-renter tenant base. Strengths: employment A+, housing A+, crime A; Watch: cost of living D+, amenities F, commute D-.
- Marlboro Central School District (suburban): math 43% / reading 55% proficiency, ranked #366 of 590 in NY (top 62%) — families likely to look elsewhere, expect single-tenant / working-renter base with shorter leases.
- Watch-outs: flood insurance adds $66/mo; HOA is 47% of rent.
- Market conditions: Rents flat; 383 active listings in the ZIP; 4 comparable units currently listed for rent nearby; rentals lingering (median 44d on market — plan ~5-8 weeks vacancy on turnover, expect pricing pressure); 75% of comp listings sitting > 30 days — soft ceiling on asking rent; solid renter incomes; 1,746 units permitted in Orange County in 2024 (1,265 in 5+ unit buildings).
- Climate carrying-cost: severe flood risk — expect insurance premiums to compound above CPI over the hold.
- Cap rate 6.6% vs local median 3.0% in Marlboro — top-decile yield for the area; either an underpriced asset or a hidden risk that comps aren't pricing in. Stress-test before assuming the spread holds.
Questions for listing agent
- What do current leases actually rent for vs. the listed asking? Can we see a recent rent roll and the last 12 months of T-12 income?
- What's the actual annual flood-insurance premium (NFIP or private), and is the property in a SFHA with mandatory coverage?
- What does the HOA fee cover, when was the last increase, and are there any pending special assessments or reserve-fund shortfalls?
- Is there a deadline driving the sale (1031 exchange, divorce, estate, relocation)? That informs how much negotiation room exists.
- Schools are B-rated — typically a magnet for longer-tenancy family renters. What's the average tenant stay here, and is there a school-zone premium baked into asking?
- What's the average days-on-market for RENTAL listings here right now (not sales)? A rising rental-DOM trend means longer vacancies and softer asking-rent achievability than the comps imply.
- What's the recent tenant-quality profile in this submarket — average credit score on applications, eviction rate, late-payment / NSF rate, and stable-employment percentage? A property-management company in the area should have these aggregated.
- How much new for-sale + rental construction is in the pipeline within 1–3 miles? Heavy new supply typically softens prices + rents 12–24 months out; constrained supply supports both.
CashFlowRE · CFR-PPQ24S83X9JNHT
· Data 2 days ago
cashflowre.app · 2026-05-29