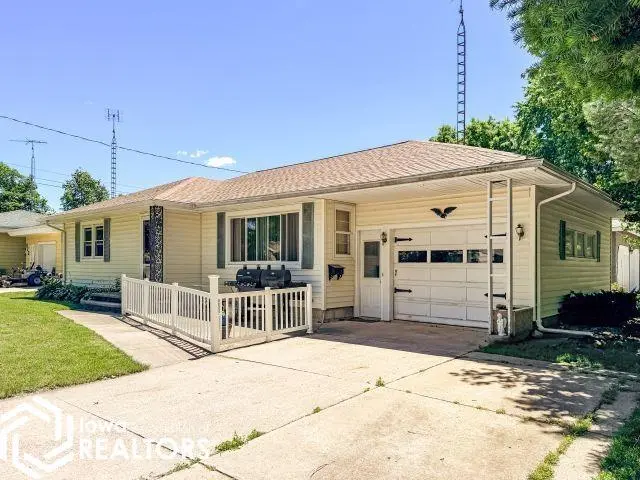
607 7th Ave NE
Hampton, IA 50441
$129,900C
2 bd · 2.5 ba ·
1,702 sqft ·
Built 1959
· SingleFamily
· Pending
· 4 DOM
Cashflow @ list (25.0% down · 7.5%)
Estimated rent
$961/mo
Mortgage (P&I)
−$681
Tax + insurance
−$136
HOA
−$0
Vac / Maint / Mgmt
−$202
Net cashflow
$-58/mo
Annual
$-692/yr
Cap rate
5.76%
Cash-on-cash
-1.90%
DSCR
0.92
1% rule
0.74%
Cash to close
$36,372
Investor read
- This is a 2-bed/2.5-bath single-family listed at $130k.
- At list price, monthly cash flow is $-58 ($-692/yr) — negative.
- To cash-flow at today's rent, offer at most $120k (7.8% below list).
- To meet the 1% rule (rent ≥ 1% of price), the offer needs to be $96k (26.0% below list).
- Only 4 days on market — expect competitive offers; lowballing is unlikely to land.
- Recommended offer: $96k (26.0% below list) — sets the bar for 1% rule.
- In year one you build about $14k of equity ($898 loan paydown + $13k appreciation (10.0% local appreciation)).
- Location reads 72/100 on livability (#304 in IA) — a middle-class / working-renter tenant base. Strengths: crime A+, cost of living A+, health & safety A+; Watch: employment D+, amenities F, commute F.
- Hampton-Dumont Community School District (rural): math 56% / reading 65% proficiency, ranked #243 of 289 in IA (top 84%) — acceptable for families but not a draw, mixed tenant base, ~2y average lease.
- Zoned schools: South Side Elementary School (math 62% / reading 57%, grade B-, #390 of 616 statewide, top 69%, 312 students, 58% FRL); Hampton-Dumont Middle School (math 60% / reading 65%, grade B+, #174 of 246 statewide, top 71%, 363 students, 58% FRL); Hampton-Dumont High School (math 46% / reading 68%, grade C, #279 of 336 statewide, top 85%, 480 students, 52% FRL).
- Watch-outs: built in 1959 — expect roof / HVAC / electrical / plumbing capex.
- Market conditions: 35 active listings in the ZIP; 2 units permitted in Franklin County in 2024 (0 in 5+ unit buildings).
- Franklin County population projected at -17% by 2050 — secular population decline; favor cash flow + early exit over multi-decade hold.
- At projected returns (10.0% appreciation + 3.0% rent growth), your $36k cash investment doubles in ~3 years — after that, you're playing with house money.
- By year 3, paydown + projected appreciation supports a ~$35k cash-out refi (75% LTV) — recoverable capital for the next deal without selling this one.
- Cap rate 5.8% vs local median 4.0% in Hampton — top-decile yield for the area; either an underpriced asset or a hidden risk that comps aren't pricing in. Stress-test before assuming the spread holds.
Questions for listing agent
- What do current leases actually rent for vs. the listed asking? Can we see a recent rent roll and the last 12 months of T-12 income?
- Built in 1959 — when were the roof, HVAC, electrical panel, plumbing, and water heater last replaced?
- Is there a deadline driving the sale (1031 exchange, divorce, estate, relocation)? That informs how much negotiation room exists.
- What's the average days-on-market for RENTAL listings here right now (not sales)? A rising rental-DOM trend means longer vacancies and softer asking-rent achievability than the comps imply.
- What's the recent tenant-quality profile in this submarket — average credit score on applications, eviction rate, late-payment / NSF rate, and stable-employment percentage? A property-management company in the area should have these aggregated.
- How much new for-sale + rental construction is in the pipeline within 1–3 miles? Heavy new supply typically softens prices + rents 12–24 months out; constrained supply supports both.
CashFlowRE · CFR-PRT7T36GFP6Y8K
· Data 4 h ago
cashflowre.app · 2026-05-29