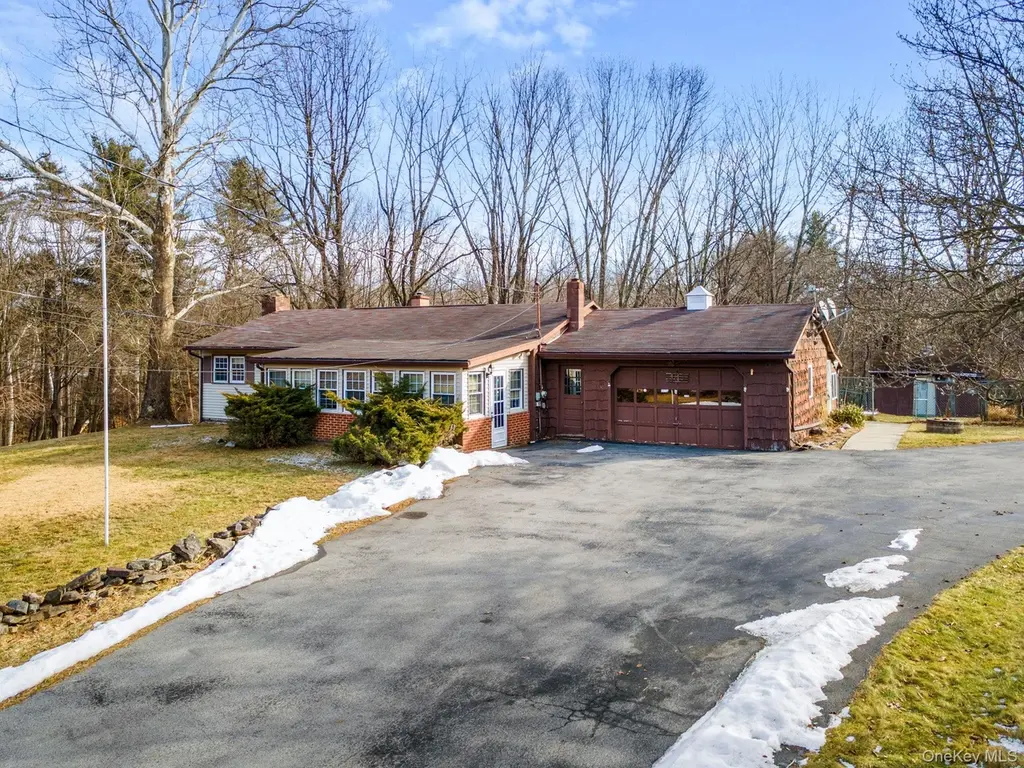
50 Brola Rd
Bloomingburg, NY 10940
$325,000D
3 bd · 1.0 ba ·
1,196 sqft ·
Built 1965
· SingleFamily
· Pending
· 56 DOM
Cashflow @ list (25.0% down · 7.5%)
Estimated rent
$2,652/mo
Mortgage (P&I)
−$1,704
Tax + insurance
−$660
HOA
−$0
Vac / Maint / Mgmt
−$557
Net cashflow
$-269/mo
Annual
$-3,231/yr
Cap rate
5.30%
Cash-on-cash
-3.55%
DSCR
0.84
1% rule
0.82%
Cash to close
$91,000
Investor read
- This is a 3-bed/1.0-bath single-family listed at $325k.
- At list price, monthly cash flow is $-269 ($-3k/yr) — negative.
- To cash-flow at today's rent, offer at most $277k (14.6% below list).
- To meet the 1% rule (rent ≥ 1% of price), the offer needs to be $265k (18.4% below list).
- It's been on market 56 days — a 3% lower offer ($315k) is reasonable based on typical stale-listing flexibility.
- Recommended offer: $265k (18.4% below list) — sets the bar for 1% rule.
- Local home prices are declining (-3.0%/yr); year-one equity from $2k of loan paydown is wiped out by about $10k of value loss. Plan a longer hold.
- Location reads 49/100 on livability (#1,175 in NY) — a working-class tenant base; expect higher turnover. Watch: cost of living D+, housing D+, crime F.
- Minisink Valley Central School District (rural): math 51% / reading 59% proficiency, ranked #254 of 590 in NY (top 43%) — acceptable for families but not a draw, mixed tenant base, ~2y average lease; only 17% free/reduced lunch — higher-income household profile.
- Zoned schools: Otisville Elementary School (math 27% / reading 57%, grade F, #1,361 of 2,108 statewide, top 67%, 589 students, 30% FRL); Minisink Valley Middle School (math 27% / reading 58%, grade D-, #373 of 729 statewide, top 52%, 775 students, 28% FRL); Minisink Valley High School (math 94% / reading 75%, grade A, #379 of 1,100 statewide, top 36%, 1,172 students, 28% FRL).
- Market conditions: Rents rising fast (+8.2%/yr); 279 active listings in the ZIP; solid renter incomes; 1,746 units permitted in Orange County in 2024 (1,265 in 5+ unit buildings).
- 2 sale attempts with the ask held roughly flat each time — persistent listings suggest the price (not the market) is what's stuck; bring a comps-based counter.
- Current owner paid $280k; 16% above their basis — modest negotiation headroom, anchor on the comps not their cost.
- Cap rate 5.3% vs local median 3.6% in Bloomingburg — top-decile yield for the area; either an underpriced asset or a hidden risk that comps aren't pricing in. Stress-test before assuming the spread holds.
- This rent runs 37% of the median local income ($87k/yr) — at the standard rent-burdened threshold; future hikes will face affordability resistance.
Questions for listing agent
- What do current leases actually rent for vs. the listed asking? Can we see a recent rent roll and the last 12 months of T-12 income?
- It's been on market 56 days. Have you received any prior offers? Is the seller open to a 18% concession, seller financing, or rate buy-down credit?
- Built in 1965 — when were the roof, HVAC, electrical panel, plumbing, and water heater last replaced?
- Is there a deadline driving the sale (1031 exchange, divorce, estate, relocation)? That informs how much negotiation room exists.
- Schools are F-rated, which usually means shorter tenancies and higher turnover. Who's the typical renter profile here, and what's been the actual vacancy rate?
- Crime grade is F in this area — have there been break-ins, vandalism, or insurance claims at this property in the last 3 years? What carrier currently insures it and at what premium?
- The area grade is low — what's the realistic commute time and amenity access for the typical tenant pool here? Any planned neighborhood developments (good or bad) we should know about?
- What's the average days-on-market for RENTAL listings here right now (not sales)? A rising rental-DOM trend means longer vacancies and softer asking-rent achievability than the comps imply.
CashFlowRE · CFR-PRTXPRBD9PJ6NA
· Data 4 weeks ago
cashflowre.app · 2026-05-29