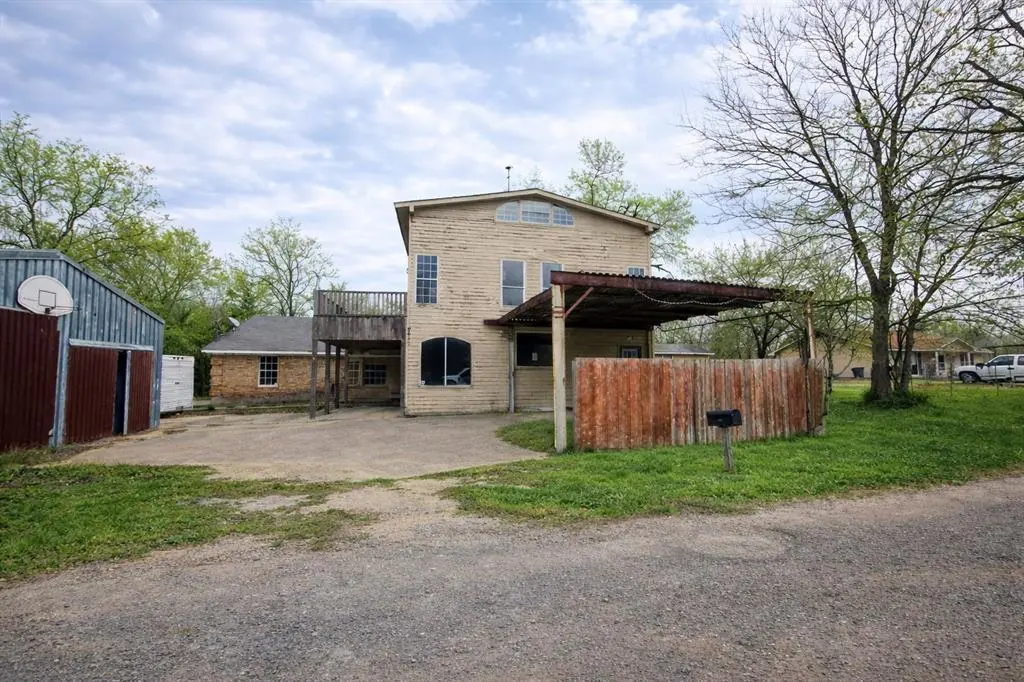
9611 Private Road 3826
Hawk Cove, TX 75474
$160,000B-
5 bd · 1.0 ba ·
2,665 sqft ·
Built 1996
· SingleFamily
· Active
· 16 DOM
Cashflow @ list (25.0% down · 7.5%)
Estimated rent
$2,030/mo
Mortgage (P&I)
−$839
Tax + insurance
−$400
HOA
−$0
Vac / Maint / Mgmt
−$426
Net cashflow
$364/mo
Annual
$4,370/yr
Cap rate
9.02%
Cash-on-cash
9.75%
DSCR
1.43
1% rule
1.27%
Cash to close
$44,800
Investor read
- This is a 5-bed/1.0-bath single-family listed at $160k.
- At list price, monthly cash flow is $364 ($4k/yr) — positive.
- The deal already cash-flows at list — no discount required.
- Meets the 1% rule at list price ($2k rent vs $160k).
- It's been on market 16 days — a 2% lower offer ($158k) is reasonable based on typical stale-listing flexibility.
- Recommended offer: $158k (1.5% below list) — sets the bar for market timing.
- In year one you build about $17k of equity ($1k loan paydown + $16k appreciation (10.0% local appreciation)).
- Location reads 50/100 on livability (#1,499 in TX) — a working-class tenant base; expect higher turnover. Strengths: cost of living A+, housing A+; Watch: schools F, crime F, amenities F.
- Quinlan ISD (rural): math 27% / reading 34% proficiency, ranked #610 of 826 in TX (top 74%) — families likely to look elsewhere, expect single-tenant / working-renter base with shorter leases.
- Watch-outs: property tax is 2.5% of price.
- Market conditions: 335 active listings in the ZIP; 1,289 units permitted in Hunt County in 2024 (527 in 5+ unit buildings).
- Hunt County population projected at +15% by 2050 — modest demand growth; plan on rents tracking national, not racing it.
- 6 sale attempts since 10y ago; this cycle's ask has dropped $20k (11%) from the opening price — seller is motivated, your offer sets the floor, not the list.
- At projected returns (10.0% appreciation + 3.0% rent growth), your $45k cash investment doubles in ~2 years — after that, you're playing with house money.
- By year 3, paydown + projected appreciation supports a ~$43k cash-out refi (75% LTV) — recoverable capital for the next deal without selling this one.
- Climate carrying-cost: major wind risk, 27% chance of damaging wind over 30y; extreme-heat days projected 7→23/yr by 2055 (HVAC capex compounding) — expect insurance premiums to compound above CPI over the hold.
- Cap rate 9.0% vs local median 3.6% in Hawk Cove — top-decile yield for the area; either an underpriced asset or a hidden risk that comps aren't pricing in. Stress-test before assuming the spread holds.
- This rent runs 38% of the median local income ($64k/yr) — at the standard rent-burdened threshold; future hikes will face affordability resistance.
Questions for listing agent
- Property tax is high relative to price — has the assessment been appealed recently, and will the sale trigger a re-assessment?
- Is there a deadline driving the sale (1031 exchange, divorce, estate, relocation)? That informs how much negotiation room exists.
- Schools are F-rated, which usually means shorter tenancies and higher turnover. Who's the typical renter profile here, and what's been the actual vacancy rate?
- Crime grade is F in this area — have there been break-ins, vandalism, or insurance claims at this property in the last 3 years? What carrier currently insures it and at what premium?
- What's the average days-on-market for RENTAL listings here right now (not sales)? A rising rental-DOM trend means longer vacancies and softer asking-rent achievability than the comps imply.
- What's the recent tenant-quality profile in this submarket — average credit score on applications, eviction rate, late-payment / NSF rate, and stable-employment percentage? A property-management company in the area should have these aggregated.
- How much new for-sale + rental construction is in the pipeline within 1–3 miles? Heavy new supply typically softens prices + rents 12–24 months out; constrained supply supports both.
CashFlowRE · CFR-PV4DW3998X3FGF
· Data 2 days ago
cashflowre.app · 2026-05-29