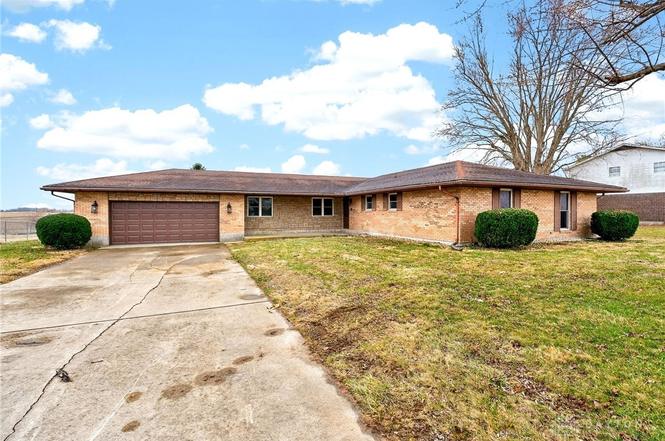
2333 State Route 730
Wilmington, OH 45177
$335,000B
3 bd · 2.0 ba ·
1,936 sqft ·
Built 1977
· SingleFamily
· Pending
· 41 DOM
Cashflow @ list (25.0% down · 7.5%)
Estimated rent
$4,028/mo
Mortgage (P&I)
−$1,757
Tax + insurance
−$331
HOA
−$0
Vac / Maint / Mgmt
−$846
Net cashflow
$1,094/mo
Annual
$13,132/yr
Cap rate
10.21%
Cash-on-cash
14.00%
DSCR
1.62
1% rule
1.20%
Cash to close
$93,800
Investor read
- This is a 3-bed/2.0-bath single-family listed at $335k.
- At list price, monthly cash flow is $1k ($13k/yr) — positive.
- The deal already cash-flows at list — no discount required.
- Meets the 1% rule at list price ($4k rent vs $335k).
- It's been on market 41 days — a 3% lower offer ($325k) is reasonable based on typical stale-listing flexibility.
- Recommended offer: $325k (3.0% below list) — sets the bar for market timing.
- Local home prices are declining (-3.0%/yr); year-one equity from $2k of loan paydown is wiped out by about $10k of value loss. Plan a longer hold.
- Location reads 77/100 on livability (#202 in OH, #3,127 nationally) — a middle-class / working-renter tenant base. Strengths: cost of living A+, housing A+, health & safety A+; Watch: schools C-, amenities D, commute F.
- Wilmington City (town): math 42% / reading 51% proficiency, ranked #492 of 656 in OH (top 75%) — families likely to look elsewhere, expect single-tenant / working-renter base with shorter leases.
- Market conditions: 107 active listings in the ZIP; 3 comparable units currently listed for rent nearby; rentals leasing fast (median 3d on market — plan ~1-2 weeks tenant-placement turnaround); 119 units permitted in Clinton County in 2024 (0 in 5+ unit buildings).
- Clinton County population projected at -12% by 2050 — secular population decline; favor cash flow + early exit over multi-decade hold.
- At projected returns (-3.0% appreciation + 3.0% rent growth), your $94k cash investment doubles in ~9 years — after that, you're playing with house money.
- Cap rate 10.2% vs local median 6.2% in Wilmington — top-decile yield for the area; either an underpriced asset or a hidden risk that comps aren't pricing in. Stress-test before assuming the spread holds.
- At $4,028/mo this rent would consume 69% of the median local household income ($70k/yr) — very limited rent-growth headroom before tenants either downsize or default.
Questions for listing agent
- It's been on market 41 days. Have you received any prior offers? Is the seller open to a 3% concession, seller financing, or rate buy-down credit?
- Built in 1977 — when were the roof, HVAC, electrical panel, plumbing, and water heater last replaced?
- Is there a deadline driving the sale (1031 exchange, divorce, estate, relocation)? That informs how much negotiation room exists.
- What's the average days-on-market for RENTAL listings here right now (not sales)? A rising rental-DOM trend means longer vacancies and softer asking-rent achievability than the comps imply.
- What's the recent tenant-quality profile in this submarket — average credit score on applications, eviction rate, late-payment / NSF rate, and stable-employment percentage? A property-management company in the area should have these aggregated.
- How much new for-sale + rental construction is in the pipeline within 1–3 miles? Heavy new supply typically softens prices + rents 12–24 months out; constrained supply supports both.
CashFlowRE · CFR-PW9JS3867B78M5
· Data 2 weeks ago
cashflowre.app · 2026-05-29