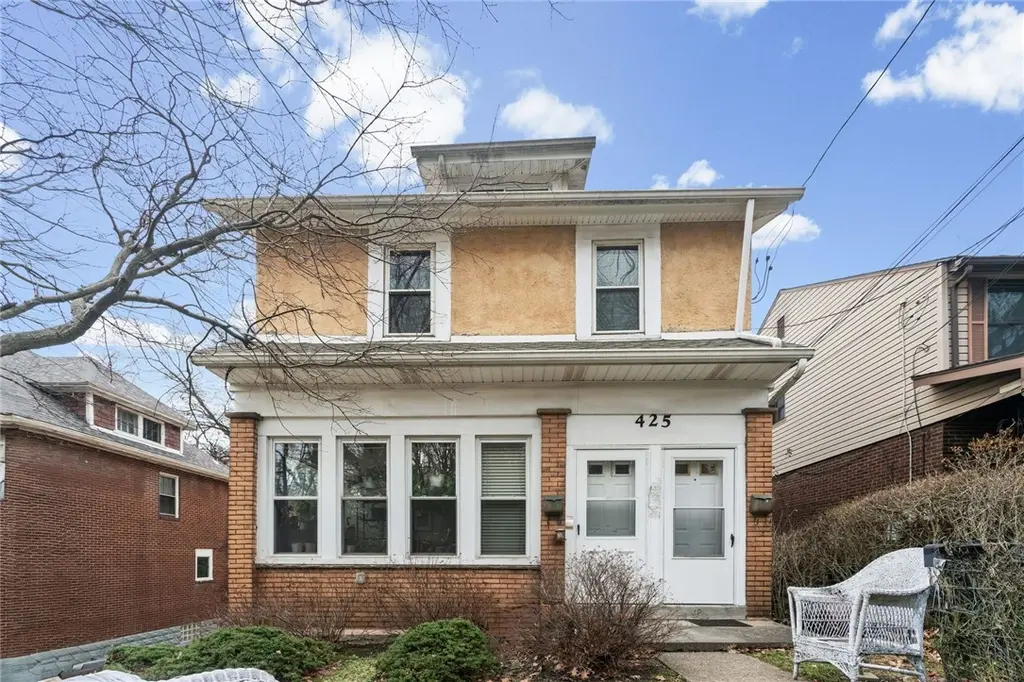
425 Braddock Rd
Forest Hills, PA 15221
$280,000D+
5 bd · 3.0 ba ·
1,938 sqft ·
Built 1930
· MultiFamily
· Active
· 13 DOM
Cashflow @ list (25.0% down · 7.5%)
Estimated rent
$2,907/mo
Mortgage (P&I)
−$1,468
Tax + insurance
−$697
HOA
−$0
Vac / Maint / Mgmt
−$610
Net cashflow
$131/mo
Annual
$1,574/yr
Cap rate
7.09%
Cash-on-cash
2.86%
DSCR
1.13
1% rule
1.04%
Cash to close
$78,400
Investor read
- This is a 3 × 1-bed/1.0-bath units multifamily listed at $280k.
- At list price, monthly cash flow is $131 ($2k/yr) — positive. Per door: $44/mo.
- The deal already cash-flows at list — no discount required.
- Meets the 1% rule at list price ($3k rent vs $280k).
- Only 13 days on market — expect competitive offers; lowballing is unlikely to land.
- Local home prices are declining (-3.0%/yr); year-one equity from $2k of loan paydown is wiped out by about $8k of value loss. Plan a longer hold.
- Location reads 83/100 on livability (#112 in PA, #873 nationally) — a professional / high-income tenant draw. Strengths: schools A+, crime A+, commute A+; Watch: amenities F.
- Woodland Hills SD (suburban): math 13% / reading 30% proficiency, ranked #486 of 539 in PA (top 90%) — low school quality limits family demand, transient renter base, plan for 1-2y turnover; 69% free/reduced lunch — lower-income household profile, screen leases tightly.
- Watch-outs: flood insurance adds $56/mo; built in 1930 — expect roof / HVAC / electrical / plumbing capex.
- Market conditions: Rents rising (+3.9%/yr); 118 active listings in the ZIP; 2 comparable units currently listed for rent nearby; 2,996 units permitted in Allegheny County in 2024 (1,588 in 5+ unit buildings).
- 3 sale attempts since 5y ago with the ask held roughly flat each time — persistent listings suggest the price (not the market) is what's stuck; bring a comps-based counter.
- Current owner paid $225k; 24% above their basis — modest negotiation headroom, anchor on the comps not their cost.
- Climate carrying-cost: severe flood risk — expect insurance premiums to compound above CPI over the hold.
- Cap rate 7.1% vs local median 4.2% in Forest Hills — top-decile yield for the area; either an underpriced asset or a hidden risk that comps aren't pricing in. Stress-test before assuming the spread holds.
- At $2,907/mo this rent would consume 63% of the median local household income ($55k/yr) (locally 1933% of renters already pay >50% of income on rent) — very limited rent-growth headroom before tenants either downsize or default.
Questions for listing agent
- Can we see the unit-by-unit rent roll, current vacancy, and any below-market leases? What's the average tenancy length?
- What capital expenditures (roof, boiler, parking lot, exteriors) have been made in the last 5 years, and what's planned in the next 2?
- Built in 1930 — when were the roof, HVAC, electrical panel, plumbing, and water heater last replaced?
- What's the actual annual flood-insurance premium (NFIP or private), and is the property in a SFHA with mandatory coverage?
- Is there a deadline driving the sale (1031 exchange, divorce, estate, relocation)? That informs how much negotiation room exists.
- Schools are A-rated — typically a magnet for longer-tenancy family renters. What's the average tenant stay here, and is there a school-zone premium baked into asking?
- The area grade is low — what's the realistic commute time and amenity access for the typical tenant pool here? Any planned neighborhood developments (good or bad) we should know about?
- What's the average days-on-market for RENTAL listings here right now (not sales)? A rising rental-DOM trend means longer vacancies and softer asking-rent achievability than the comps imply.
CashFlowRE · CFR-PYF5972HGC8DY5
· Data 2 days ago
cashflowre.app · 2026-05-29