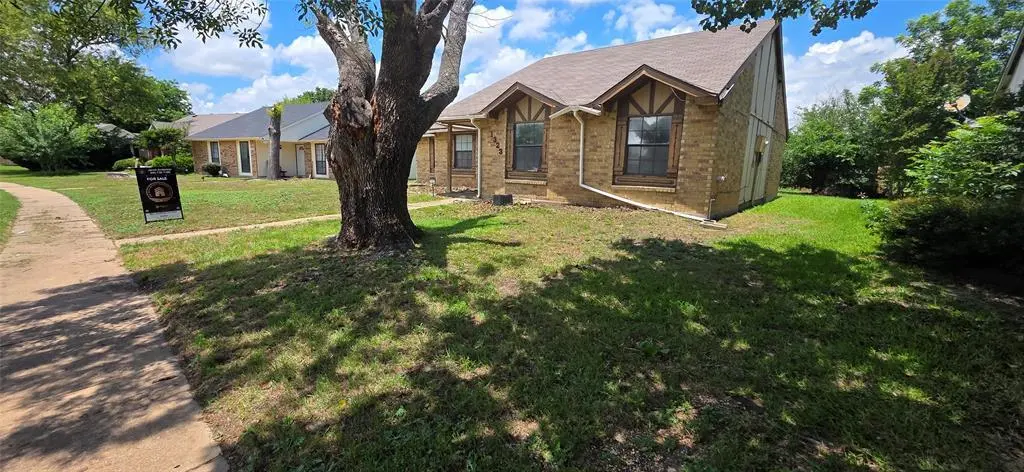
1323 Timberview Dr
Allen, TX 75002
$229,000C-
3 bd · 2.0 ba ·
1,241 sqft ·
Built 1982
· SingleFamily
· Active
· 17 DOM
Cashflow @ list (25.0% down · 7.5%)
Estimated rent
$2,174/mo
Mortgage (P&I)
−$1,201
Tax + insurance
−$496
HOA
−$0
Vac / Maint / Mgmt
−$457
Net cashflow
$21/mo
Annual
$255/yr
Cap rate
6.40%
Cash-on-cash
0.40%
DSCR
1.02
1% rule
0.95%
Cash to close
$64,120
Investor read
- This is a 3-bed/2.0-bath single-family listed at $229k.
- At list price, monthly cash flow is $21 ($255/yr) — positive.
- The deal already cash-flows at list — no discount required.
- To meet the 1% rule (rent ≥ 1% of price), the offer needs to be $217k (5.1% below list).
- It's been on market 17 days — a 2% lower offer ($226k) is reasonable based on typical stale-listing flexibility.
- Recommended offer: $217k (5.1% below list) — sets the bar for 1% rule.
- Local home prices are declining (-3.0%/yr); year-one equity from $2k of loan paydown is wiped out by about $7k of value loss. Plan a longer hold.
- Location reads 80/100 on livability (#34 in TX, #1,678 nationally) — a professional / high-income tenant draw. Strengths: crime A+, employment A+, housing A+; Watch: cost of living C-, commute F.
- Allen ISD (suburban): math 64% / reading 63% proficiency, ranked #22 of 826 in TX (top 3%) — acceptable for families but not a draw, mixed tenant base, ~2y average lease; only 16% free/reduced lunch — higher-income household profile.
- Zoned schools: Gene M Reed El (math 51% / reading 45%, grade D, #971 of 4,322 statewide, top 23%, 477 students, 39% FRL); Allen H S (math 87% / reading 22%, grade C-, #379 of 1,632 statewide, top 26%, 5,317 students, 0% FRL) — zoned schools at 19% FRL track the district average.
- Zoned-school proficiency averages 51% at this address vs 64% district-wide (-12 pts) — the specific schools serving this property underperform the Allen ISD average; the district grade overstates school quality for this exact location.
- Market conditions: Rents falling (-3.9%/yr); 518 active listings in the ZIP; 40 comparable units currently listed for rent nearby; rentals at typical pace (median 27d on market — plan ~3-4 weeks tenant-placement turnaround); 45% of comp listings sitting > 30 days — soft ceiling on asking rent; high-income renter base; 19,194 units permitted in Collin County in 2024 (3,988 in 5+ unit buildings).
- Collin County population projected at +60% by 2050 — long-run rental-demand tailwind backs the buy-and-hold thesis.
- Climate carrying-cost: major wind risk, 27% chance of damaging wind over 30y; extreme-heat days projected 7→23/yr by 2055 (HVAC capex compounding) — expect insurance premiums to compound above CPI over the hold.
- Cap rate 6.4% vs local median 2.6% in Allen — top-decile yield for the area; either an underpriced asset or a hidden risk that comps aren't pricing in. Stress-test before assuming the spread holds.
Questions for listing agent
- Is there a deadline driving the sale (1031 exchange, divorce, estate, relocation)? That informs how much negotiation room exists.
- Schools are A-rated — typically a magnet for longer-tenancy family renters. What's the average tenant stay here, and is there a school-zone premium baked into asking?
- What's the average days-on-market for RENTAL listings here right now (not sales)? A rising rental-DOM trend means longer vacancies and softer asking-rent achievability than the comps imply.
- What's the recent tenant-quality profile in this submarket — average credit score on applications, eviction rate, late-payment / NSF rate, and stable-employment percentage? A property-management company in the area should have these aggregated.
- How much new for-sale + rental construction is in the pipeline within 1–3 miles? Heavy new supply typically softens prices + rents 12–24 months out; constrained supply supports both.
CashFlowRE · CFR-PZZXN81NQN2Q8V
· Data 1 day ago
cashflowre.app · 2026-05-29