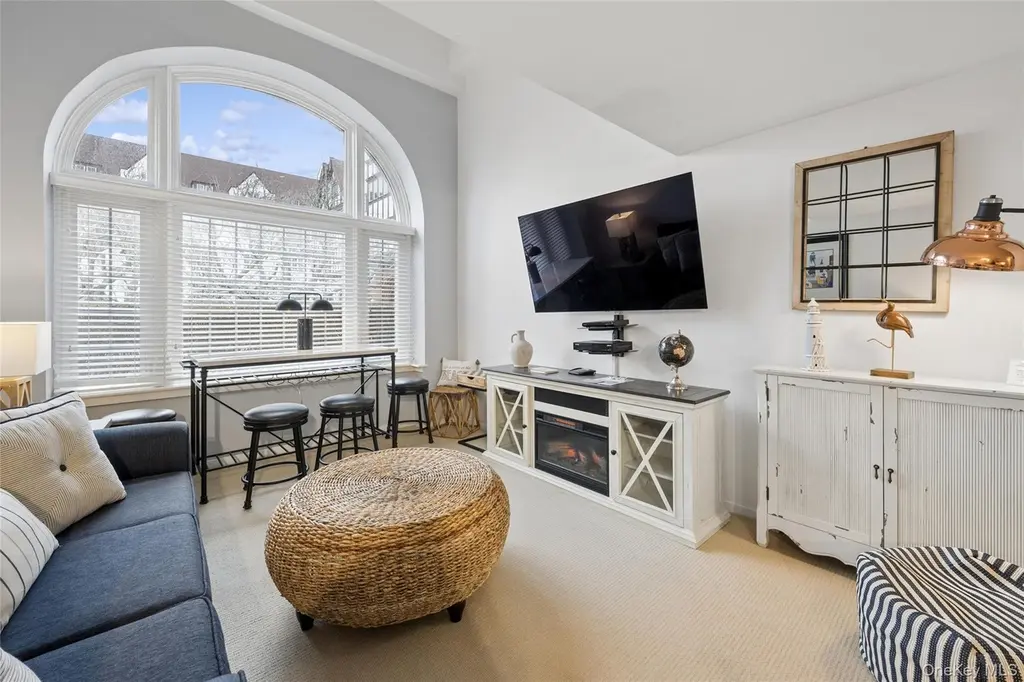
236 Edgemere St #127
Montauk, NY 11954
$490,000A-
1 bd · 2.0 ba ·
847 sqft ·
Built 1927
· Condo
· Active
· 105 DOM
Cashflow @ list (25.0% down · 7.5%)
Estimated rent
$12,536/mo
Mortgage (P&I)
−$2,570
Tax + insurance
−$817
HOA
−$2,090
Vac / Maint / Mgmt
−$2,633
Net cashflow
$4,427/mo
Annual
$53,130/yr
Cap rate
17.14%
Cash-on-cash
38.72%
DSCR
2.72
1% rule
2.56%
Cash to close
$137,200
Investor read
- This is a 1-bed/2.0-bath condo listed at $490k. Condition is rated good.
- At list price, monthly cash flow is $4k ($53k/yr) — positive.
- The deal already cash-flows at list — no discount required.
- Meets the 1% rule at list price ($13k rent vs $490k).
- It's been on market 105 days — a 9% lower offer ($446k) is reasonable based on typical stale-listing flexibility.
- Recommended offer: $446k (9.0% below list) — sets the bar for market timing.
- Local home prices are declining (-1.8%/yr); year-one equity from $3k of loan paydown is wiped out by about $9k of value loss. Plan a longer hold.
- Location reads 69/100 on livability (#474 in NY) — a middle-class / working-renter tenant base. Strengths: crime A+, employment A+, health & safety A; Watch: housing C-, amenities F, commute F.
- Montauk Union Free School District (town): math 50% / reading 60% proficiency, ranked #311 of 755 in NY (top 41%) — acceptable for families but not a draw, mixed tenant base, ~2y average lease.
- Watch-outs: built in 1927 — expect roof / HVAC / electrical / plumbing capex.
- Market conditions: 39 active listings in the ZIP; 2 comparable units currently listed for rent nearby; high-income renter base; 1,366 units permitted in Suffolk County in 2024 (216 in 5+ unit buildings).
- Suffolk County population projected to shrink 5% by 2050 — rents likely to lag national; underwrite the cash flow, not the appreciation.
- At projected returns (-1.8% appreciation + 3.0% rent growth), your $137k cash investment doubles in ~3 years — after that, you're playing with house money.
- Cap rate 17.1% vs local median 7.9% in Montauk — top-decile yield for the area; either an underpriced asset or a hidden risk that comps aren't pricing in. Stress-test before assuming the spread holds.
- At $12,536/mo this rent would consume 105% of the median local household income ($143k/yr) (locally 20% of renters already pay >50% of income on rent) — very limited rent-growth headroom before tenants either downsize or default.
Questions for listing agent
- It's been on market 105 days. Have you received any prior offers? Is the seller open to a 9% concession, seller financing, or rate buy-down credit?
- Built in 1927 — when were the roof, HVAC, electrical panel, plumbing, and water heater last replaced?
- What does the HOA fee cover, when was the last increase, and are there any pending special assessments or reserve-fund shortfalls?
- Any open or pending special assessments — roof, HVAC, plumbing, elevator, façade? What's the per-unit balance and payoff schedule, and is the seller paying it off at close or rolling it to the buyer?
- Why hasn't it sold? Are there any deal-killer items the seller is aware of (foundation, flood, title, zoning, code violations)?
- Is there a deadline driving the sale (1031 exchange, divorce, estate, relocation)? That informs how much negotiation room exists.
- What's the average days-on-market for RENTAL listings here right now (not sales)? A rising rental-DOM trend means longer vacancies and softer asking-rent achievability than the comps imply.
- What's the recent tenant-quality profile in this submarket — average credit score on applications, eviction rate, late-payment / NSF rate, and stable-employment percentage? A property-management company in the area should have these aggregated.
CashFlowRE · CFR-Q1DMRF35HC3KYT
· Data 2 days ago
cashflowre.app · 2026-05-29