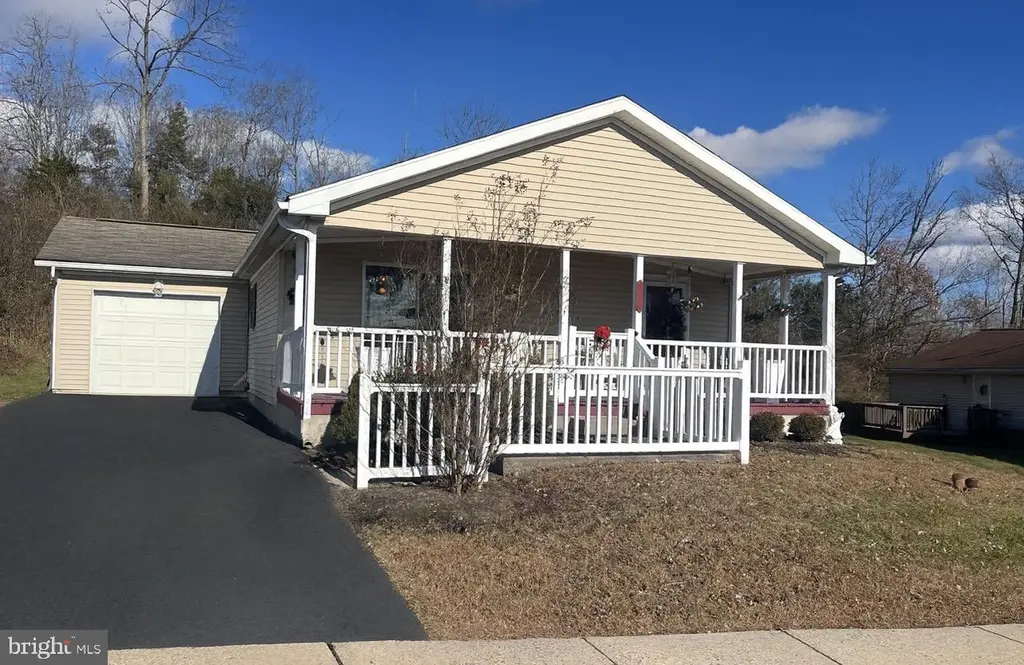
66 Random Rd
Stowe, PA 19518
$219,000D-
2 bd · 2.0 ba ·
1,260 sqft ·
Built 2007
· Manufactured
· Active
· 159 DOM
Cashflow @ list (25.0% down · 7.5%)
Estimated rent
$1,502/mo
Mortgage (P&I)
−$1,148
Tax + insurance
−$292
HOA
−$0
Vac / Maint / Mgmt
−$315
Net cashflow
$-255/mo
Annual
$-3,055/yr
Cap rate
4.90%
Cash-on-cash
-4.98%
DSCR
0.78
1% rule
0.69%
Cash to close
$61,320
Investor read
- This is a 2-bed/2.0-bath manufactured listed at $219k.
- At list price, monthly cash flow is $-255 ($-3k/yr) — negative.
- To cash-flow at today's rent, offer at most $174k (20.5% below list).
- To meet the 1% rule (rent ≥ 1% of price), the offer needs to be $150k (31.4% below list).
- It's been on market 159 days — a 12% lower offer ($193k) is reasonable based on typical stale-listing flexibility.
- Recommended offer: $150k (31.4% below list) — sets the bar for 1% rule.
- Local home prices are declining (-3.0%/yr); year-one equity from $2k of loan paydown is wiped out by about $7k of value loss. Plan a longer hold.
- Location reads 75/100 on livability (#441 in PA, #4,019 nationally) — a middle-class / working-renter tenant base. Strengths: crime A+, cost of living A+, housing A+; Watch: amenities F, commute F.
- Boyertown Area SD (suburban): math 44% / reading 53% proficiency, ranked #167 of 539 in PA (top 31%) — families likely to look elsewhere, expect single-tenant / working-renter base with shorter leases; only 16% free/reduced lunch — higher-income household profile.
- Zoned schools: Boyertown Area Shs (math 73% / reading 50%, grade B-, #74 of 437 statewide, top 17%, 2,158 students, 25% FRL).
- Zoned-school proficiency averages 61% at this address vs 48% district-wide (+13 pts) — the actual schools serving this property are materially stronger than the Boyertown Area SD average implies; a family-tenant draw the district grade alone would hide.
- Market conditions: 61 active listings in the ZIP; 1 comparable units currently listed for rent nearby; 258 units permitted in Berks County in 2024 (27 in 5+ unit buildings).
- Berks County population projected at +3% by 2050 — modest demand growth; plan on rents tracking national, not racing it.
- 5 sale attempts since 19y ago; this cycle's ask has dropped $16k (7%) from the opening price — seller is motivated, your offer sets the floor, not the list.
- Current owner paid $190k; 15% above their basis — modest negotiation headroom, anchor on the comps not their cost.
- Climate carrying-cost: extreme-heat days projected 7→16/yr by 2055 (HVAC capex compounding) — expect insurance premiums to compound above CPI over the hold.
Questions for listing agent
- What do current leases actually rent for vs. the listed asking? Can we see a recent rent roll and the last 12 months of T-12 income?
- It's been on market 159 days. Have you received any prior offers? Is the seller open to a 31% concession, seller financing, or rate buy-down credit?
- Why hasn't it sold? Are there any deal-killer items the seller is aware of (foundation, flood, title, zoning, code violations)?
- Is there a deadline driving the sale (1031 exchange, divorce, estate, relocation)? That informs how much negotiation room exists.
- The area grade is low — what's the realistic commute time and amenity access for the typical tenant pool here? Any planned neighborhood developments (good or bad) we should know about?
- What's the average days-on-market for RENTAL listings here right now (not sales)? A rising rental-DOM trend means longer vacancies and softer asking-rent achievability than the comps imply.
- What's the recent tenant-quality profile in this submarket — average credit score on applications, eviction rate, late-payment / NSF rate, and stable-employment percentage? A property-management company in the area should have these aggregated.
- How much new for-sale + rental construction is in the pipeline within 1–3 miles? Heavy new supply typically softens prices + rents 12–24 months out; constrained supply supports both.
CashFlowRE · CFR-Q1J3393ZZBRF5E
· Data 1 h ago
cashflowre.app · 2026-05-29