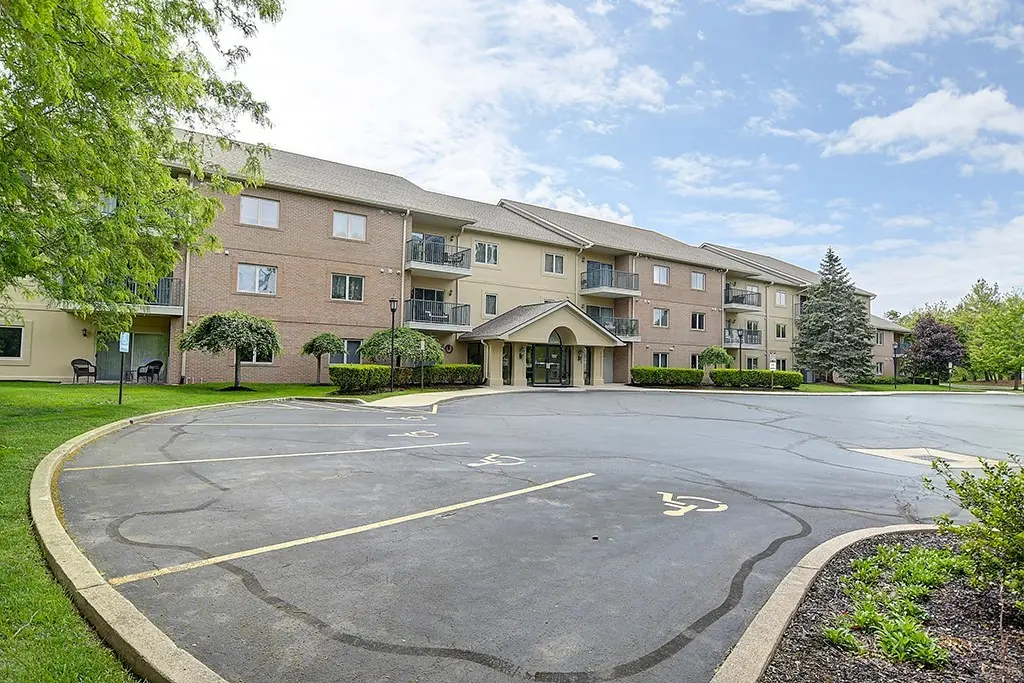
3170 E Stroop Rd #301
Kettering, OH 45440
$172,000D
2 bd · 2.0 ba ·
1,064 sqft ·
Built 1997
· Condo
· Pending
· 11 DOM
Cashflow @ list (25.0% down · 7.5%)
Estimated rent
$1,776/mo
Mortgage (P&I)
−$902
Tax + insurance
−$247
HOA
−$350
Vac / Maint / Mgmt
−$373
Net cashflow
$-96/mo
Annual
$-1,147/yr
Cap rate
5.63%
Cash-on-cash
-2.38%
DSCR
0.89
1% rule
1.03%
Cash to close
$48,160
Investor read
- This is a 2-bed/2.0-bath condo listed at $172k.
- At list price, monthly cash flow is $-96 ($-1k/yr) — negative.
- To cash-flow at today's rent, offer at most $155k (9.8% below list).
- Meets the 1% rule at list price ($2k rent vs $172k).
- Only 11 days on market — expect competitive offers; lowballing is unlikely to land.
- Recommended offer: $155k (9.8% below list) — sets the bar for cash-flow.
- Local home prices are declining (-3.0%/yr); year-one equity from $1k of loan paydown is wiped out by about $5k of value loss. Plan a longer hold.
- Location reads 83/100 on livability (#61 in OH, #922 nationally) — a professional / high-income tenant draw. Strengths: crime A+, cost of living A+, housing A+; Watch: commute F.
- Kettering City School District (suburban): math 54% / reading 68% proficiency, ranked #277 of 656 in OH (top 42%) — acceptable for families but not a draw, mixed tenant base, ~2y average lease.
- Zoned schools: Kettering Fairmont High School (math 49% / reading 75%, grade B-, #202 of 781 statewide, top 29%, 2,486 students, 32% FRL) — zoned schools at 32% FRL track the district average.
- Market conditions: Rents rising fast (+4.3%/yr); 119 active listings in the ZIP; 10 comparable units currently listed for rent nearby; rentals leasing fast (median 13d on market — plan ~1-2 weeks tenant-placement turnaround); solid renter incomes; 907 units permitted in Montgomery County in 2024 (416 in 5+ unit buildings).
- Montgomery County population projected at -10% by 2050 — secular population decline; favor cash flow + early exit over multi-decade hold.
- 2 sale attempts since 9y ago with the ask held roughly flat each time — persistent listings suggest the price (not the market) is what's stuck; bring a comps-based counter.
- Cap rate 5.6% vs local median 4.4% in Kettering — meaningfully above typical; check what's discounted (condition, days-on-market, listing class) to confirm the premium yield is real.
Questions for listing agent
- What do current leases actually rent for vs. the listed asking? Can we see a recent rent roll and the last 12 months of T-12 income?
- What does the HOA fee cover, when was the last increase, and are there any pending special assessments or reserve-fund shortfalls?
- Any open or pending special assessments — roof, HVAC, plumbing, elevator, façade? What's the per-unit balance and payoff schedule, and is the seller paying it off at close or rolling it to the buyer?
- Is there a deadline driving the sale (1031 exchange, divorce, estate, relocation)? That informs how much negotiation room exists.
- Schools are A-rated — typically a magnet for longer-tenancy family renters. What's the average tenant stay here, and is there a school-zone premium baked into asking?
- The area grade is low — what's the realistic commute time and amenity access for the typical tenant pool here? Any planned neighborhood developments (good or bad) we should know about?
- What's the average days-on-market for RENTAL listings here right now (not sales)? A rising rental-DOM trend means longer vacancies and softer asking-rent achievability than the comps imply.
- What's the recent tenant-quality profile in this submarket — average credit score on applications, eviction rate, late-payment / NSF rate, and stable-employment percentage? A property-management company in the area should have these aggregated.
CashFlowRE · CFR-Q2BV6Q0GSTK3EF
· Data 4 weeks ago
cashflowre.app · 2026-05-29