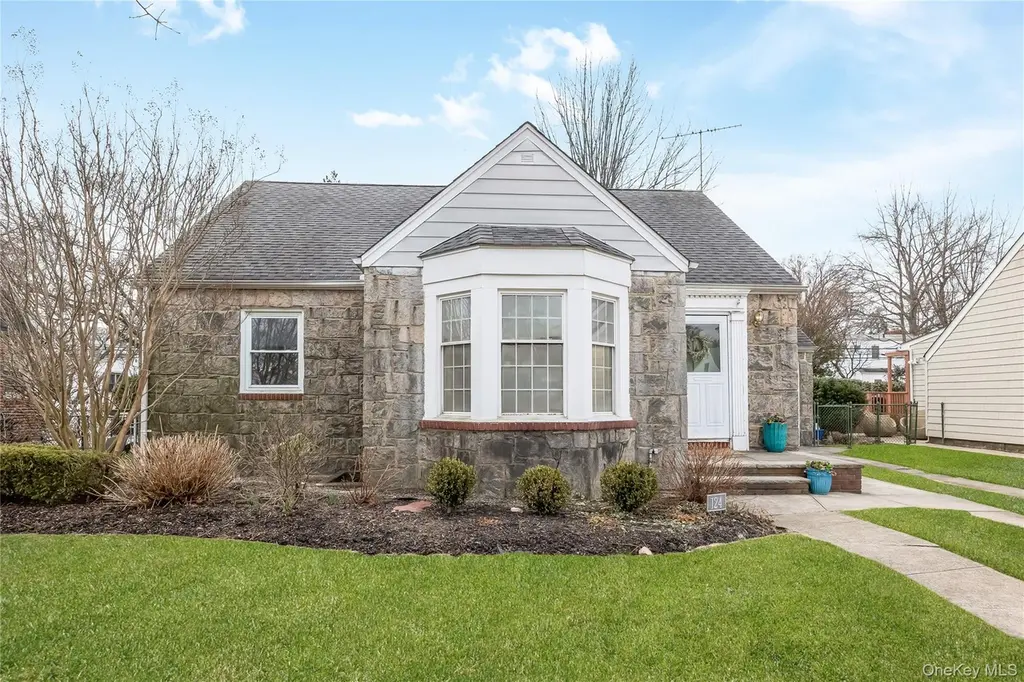
124 Greystone Rd
Rockville Centre, NY 11570
$750,000D
4 bd · 2.0 ba ·
1,670 sqft ·
Built 1941
· SingleFamily
· Pending
· 50 DOM
Cashflow @ list (25.0% down · 7.5%)
Estimated rent
$5,276/mo
Mortgage (P&I)
−$3,933
Tax + insurance
−$1,159
HOA
−$0
Vac / Maint / Mgmt
−$1,108
Net cashflow
$-925/mo
Annual
$-11,097/yr
Cap rate
4.81%
Cash-on-cash
-5.28%
DSCR
0.76
1% rule
0.70%
Cash to close
$210,000
Investor read
- This is a 4-bed/2.0-bath single-family listed at $750k.
- At list price, monthly cash flow is $-925 ($-11k/yr) — negative.
- To cash-flow at today's rent, offer at most $587k (21.8% below list).
- To meet the 1% rule (rent ≥ 1% of price), the offer needs to be $528k (29.7% below list).
- It's been on market 50 days — a 3% lower offer ($728k) is reasonable based on typical stale-listing flexibility.
- Recommended offer: $528k (29.7% below list) — sets the bar for 1% rule.
- Local home prices are declining (-3.0%/yr); year-one equity from $5k of loan paydown is wiped out by about $22k of value loss. Plan a longer hold.
- Location reads 86/100 on livability (#17 in NY, #365 nationally) — a professional / high-income tenant draw. Strengths: schools A+, amenities A+, commute A+; Watch: cost of living F.
- Oceanside Union Free School District (suburban): math 69% / reading 77% proficiency, ranked #75 of 590 in NY (top 13%) — strong family-tenant draw, lease renewals of 3-5y typical; only 10% free/reduced lunch — higher-income household profile.
- Watch-outs: built in 1941 — expect roof / HVAC / electrical / plumbing capex.
- Market conditions: 143 active listings in the ZIP; 2 comparable units currently listed for rent nearby; high-income renter base; 824 units permitted in Nassau County in 2024 (153 in 5+ unit buildings).
- Nassau County population projected at +7% by 2050 — modest demand growth; plan on rents tracking national, not racing it.
- 3 sale attempts since 14y ago with the ask held roughly flat each time — persistent listings suggest the price (not the market) is what's stuck; bring a comps-based counter.
- Current owner paid $428k; list at $750k implies a 75% gain — meaningful room to come down on a strong offer.
- Climate carrying-cost: moderate flood risk; major wind risk, 69% chance of damaging wind over 30y; extreme-heat days projected 7→16/yr by 2055 (HVAC capex compounding) — expect insurance premiums to compound above CPI over the hold.
- Cap rate 4.8% vs local median 2.5% in Rockville Centre — top-decile yield for the area; either an underpriced asset or a hidden risk that comps aren't pricing in. Stress-test before assuming the spread holds.
- This rent runs 40% of the median local income ($157k/yr) — at the standard rent-burdened threshold; future hikes will face affordability resistance.
Questions for listing agent
- What do current leases actually rent for vs. the listed asking? Can we see a recent rent roll and the last 12 months of T-12 income?
- It's been on market 50 days. Have you received any prior offers? Is the seller open to a 30% concession, seller financing, or rate buy-down credit?
- Built in 1941 — when were the roof, HVAC, electrical panel, plumbing, and water heater last replaced?
- Is there a deadline driving the sale (1031 exchange, divorce, estate, relocation)? That informs how much negotiation room exists.
- Schools are A-rated — typically a magnet for longer-tenancy family renters. What's the average tenant stay here, and is there a school-zone premium baked into asking?
- The area grade is low — what's the realistic commute time and amenity access for the typical tenant pool here? Any planned neighborhood developments (good or bad) we should know about?
- What's the average days-on-market for RENTAL listings here right now (not sales)? A rising rental-DOM trend means longer vacancies and softer asking-rent achievability than the comps imply.
- What's the recent tenant-quality profile in this submarket — average credit score on applications, eviction rate, late-payment / NSF rate, and stable-employment percentage? A property-management company in the area should have these aggregated.
CashFlowRE · CFR-Q42V0V734G1JS0
· Data 3 weeks ago
cashflowre.app · 2026-05-29