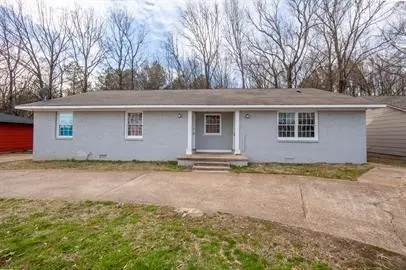
69 Carolane Dr
Jackson, TN 38305
$204,900C+
4 bd · 3.0 ba ·
1,849 sqft ·
Built 1973
· MultiFamily
· Active
· 29 DOM
Cashflow @ list (25.0% down · 7.5%)
Estimated rent
$2,408/mo
Mortgage (P&I)
−$1,075
Tax + insurance
−$151
HOA
−$0
Vac / Maint / Mgmt
−$506
Net cashflow
$677/mo
Annual
$8,126/yr
Cap rate
10.26%
Cash-on-cash
14.16%
DSCR
1.63
1% rule
1.18%
Cash to close
$57,372
Investor read
- This is a 2 × 2-bed/1-bath units multifamily listed at $205k.
- At list price, monthly cash flow is $677 ($8k/yr) — positive. Per door: $339/mo.
- The deal already cash-flows at list — no discount required.
- Meets the 1% rule at list price ($2k rent vs $205k).
- It's been on market 29 days — a 2% lower offer ($202k) is reasonable based on typical stale-listing flexibility.
- Recommended offer: $202k (1.5% below list) — sets the bar for market timing.
- Local home prices are declining (-3.0%/yr); year-one equity from $1k of loan paydown is wiped out by about $6k of value loss. Plan a longer hold.
- Location reads 62/100 on livability (#216 in TN) — a middle-class / working-renter tenant base. Strengths: cost of living A+, housing A+; Watch: health & safety C-, schools F, crime F.
- Madison County (urban): math 10% / reading 17% proficiency, ranked #131 of 139 in TN (top 94%) — low school quality limits family demand, transient renter base, plan for 1-2y turnover; 68% free/reduced lunch — lower-income household profile, screen leases tightly.
- Market conditions: Rents rising (+1.6%/yr); 508 active listings in the ZIP; 247 units permitted in Madison County in 2024 (0 in 5+ unit buildings).
- Madison County population projected at -12% by 2050 — secular population decline; favor cash flow + early exit over multi-decade hold.
- 5 sale attempts with the ask held roughly flat each time — persistent listings suggest the price (not the market) is what's stuck; bring a comps-based counter.
- At projected returns (-3.0% appreciation + 1.6% rent growth), your $57k cash investment doubles in ~10 years — after that, you're playing with house money.
- Climate carrying-cost: extreme-heat days projected 7→21/yr by 2055 (HVAC capex compounding) — expect insurance premiums to compound above CPI over the hold.
- Cap rate 10.3% vs local median 3.5% in Jackson — top-decile yield for the area; either an underpriced asset or a hidden risk that comps aren't pricing in. Stress-test before assuming the spread holds.
- This rent runs 42% of the median local income ($69k/yr) — at the standard rent-burdened threshold; future hikes will face affordability resistance.
Questions for listing agent
- Can we see the unit-by-unit rent roll, current vacancy, and any below-market leases? What's the average tenancy length?
- What capital expenditures (roof, boiler, parking lot, exteriors) have been made in the last 5 years, and what's planned in the next 2?
- Built in 1973 — when were the roof, HVAC, electrical panel, plumbing, and water heater last replaced?
- Is there a deadline driving the sale (1031 exchange, divorce, estate, relocation)? That informs how much negotiation room exists.
- Schools are F-rated, which usually means shorter tenancies and higher turnover. Who's the typical renter profile here, and what's been the actual vacancy rate?
- Crime grade is F in this area — have there been break-ins, vandalism, or insurance claims at this property in the last 3 years? What carrier currently insures it and at what premium?
- What's the average days-on-market for RENTAL listings here right now (not sales)? A rising rental-DOM trend means longer vacancies and softer asking-rent achievability than the comps imply.
- What's the recent tenant-quality profile in this submarket — average credit score on applications, eviction rate, late-payment / NSF rate, and stable-employment percentage? A property-management company in the area should have these aggregated.
CashFlowRE · CFR-Q8GDFWASRQTV82
· Data 1 day ago
cashflowre.app · 2026-05-29