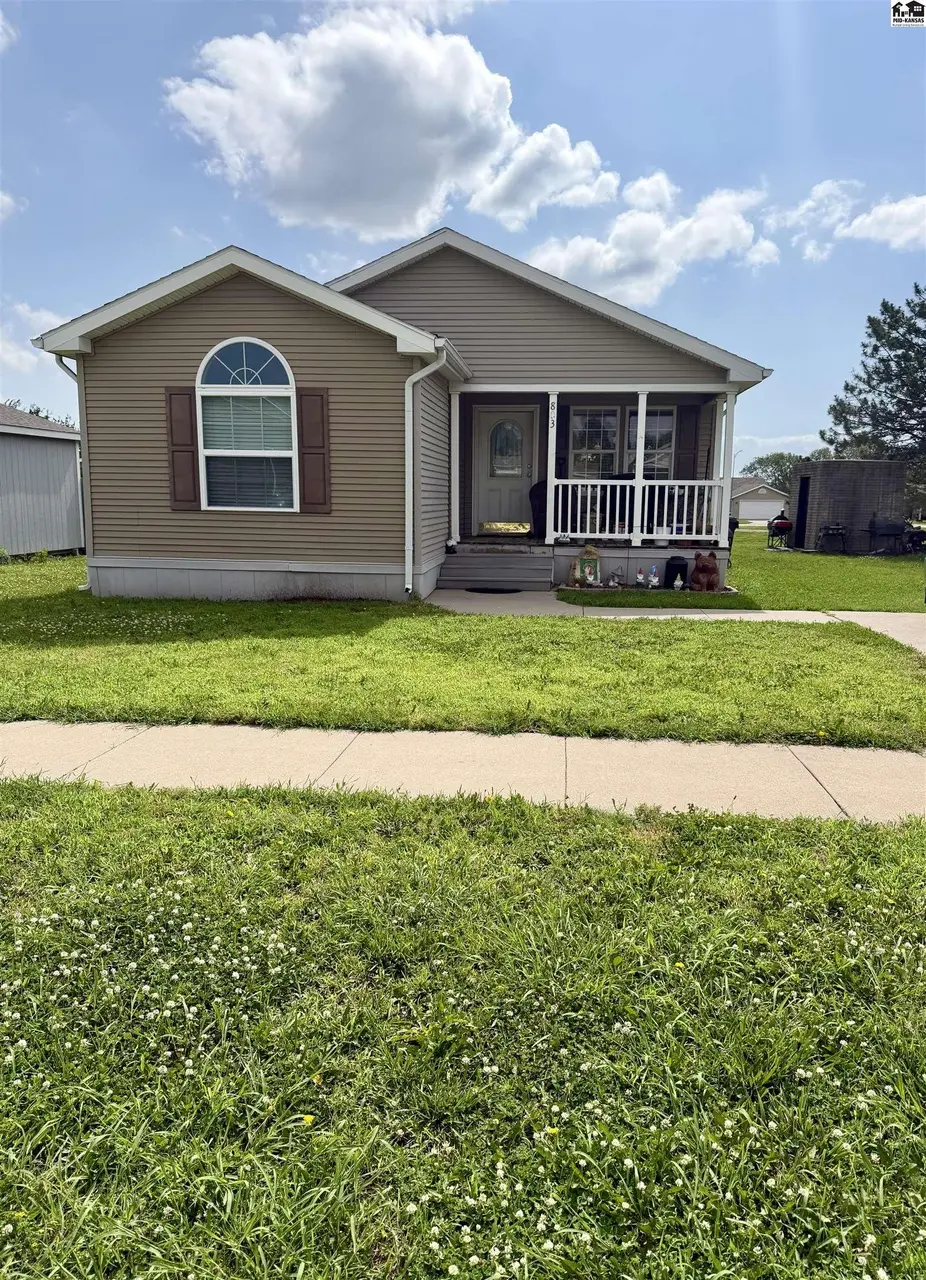
803 Wilderness Dr
McPherson, KS 67460
$100,000C+
3 bd · 2.0 ba ·
1,452 sqft ·
Built 2002
· SingleFamily
· Pending
· 7 DOM
Cashflow @ list (25.0% down · 7.5%)
Estimated rent
$1,175/mo
Mortgage (P&I)
−$524
Tax + insurance
−$140
HOA
−$0
Vac / Maint / Mgmt
−$247
Net cashflow
$264/mo
Annual
$3,165/yr
Cap rate
9.46%
Cash-on-cash
11.30%
DSCR
1.50
1% rule
1.18%
Cash to close
$28,000
Investor read
- This is a 3-bed/2.0-bath single-family listed at $100k.
- At list price, monthly cash flow is $264 ($3k/yr) — positive.
- The deal already cash-flows at list — no discount required.
- Meets the 1% rule at list price ($1k rent vs $100k).
- Only 7 days on market — expect competitive offers; lowballing is unlikely to land.
- Local home prices are declining (-3.0%/yr); year-one equity from $691 of loan paydown is wiped out by about $3k of value loss. Plan a longer hold.
- Location reads 81/100 on livability (#12 in KS, #1,567 nationally) — a professional / high-income tenant draw. Strengths: amenities A+, cost of living A+, housing A+; Watch: commute F.
- Mcpherson (town): math 25% / reading 32% proficiency, ranked #103 of 169 in KS (top 61%) — low school quality limits family demand, transient renter base, plan for 1-2y turnover.
- Zoned schools: Roosevelt Elem (math 27% / reading 42%, grade F, #388 of 684 statewide, top 61%, 266 students, 65% FRL); Mcpherson Middle School (math 21% / reading 27%, grade F, #121 of 219 statewide, top 56%, 492 students, 42% FRL); Mcpherson High (math 22% / reading 22%, grade F, #165 of 327 statewide, top 55%, 709 students, 36% FRL) — zoned schools average 48% FRL vs 32% district-wide (15 pts higher); higher-poverty schools than district average — tighter screening recommended.
- Market conditions: 149 active listings in the ZIP; 5 comparable units currently listed for rent nearby; rentals at typical pace (median 24d on market — plan ~3-4 weeks tenant-placement turnaround); solid renter incomes; 102 units permitted in McPherson County in 2024 (0 in 5+ unit buildings).
- McPherson County population projected to shrink 6% by 2050 — rents likely to lag national; underwrite the cash flow, not the appreciation.
- 4 sale attempts since 25y ago with the ask held roughly flat each time — persistent listings suggest the price (not the market) is what's stuck; bring a comps-based counter.
- At projected returns (-3.0% appreciation + 3.0% rent growth), your $28k cash investment doubles in ~10 years — after that, you're playing with house money.
- Climate carrying-cost: extreme-heat days projected 7→18/yr by 2055 (HVAC capex compounding) — expect insurance premiums to compound above CPI over the hold.
- This rent is only 17% of the median local income ($81k/yr) — well below the 30% rent-burden line; pricing power to push rent on renewal without tenant pushback.
Questions for listing agent
- Is there a deadline driving the sale (1031 exchange, divorce, estate, relocation)? That informs how much negotiation room exists.
- What's the average days-on-market for RENTAL listings here right now (not sales)? A rising rental-DOM trend means longer vacancies and softer asking-rent achievability than the comps imply.
- What's the recent tenant-quality profile in this submarket — average credit score on applications, eviction rate, late-payment / NSF rate, and stable-employment percentage? A property-management company in the area should have these aggregated.
- How much new for-sale + rental construction is in the pipeline within 1–3 miles? Heavy new supply typically softens prices + rents 12–24 months out; constrained supply supports both.
CashFlowRE · CFR-Q8VG8PE98P0ZNN
· Data 2 days ago
cashflowre.app · 2026-05-29