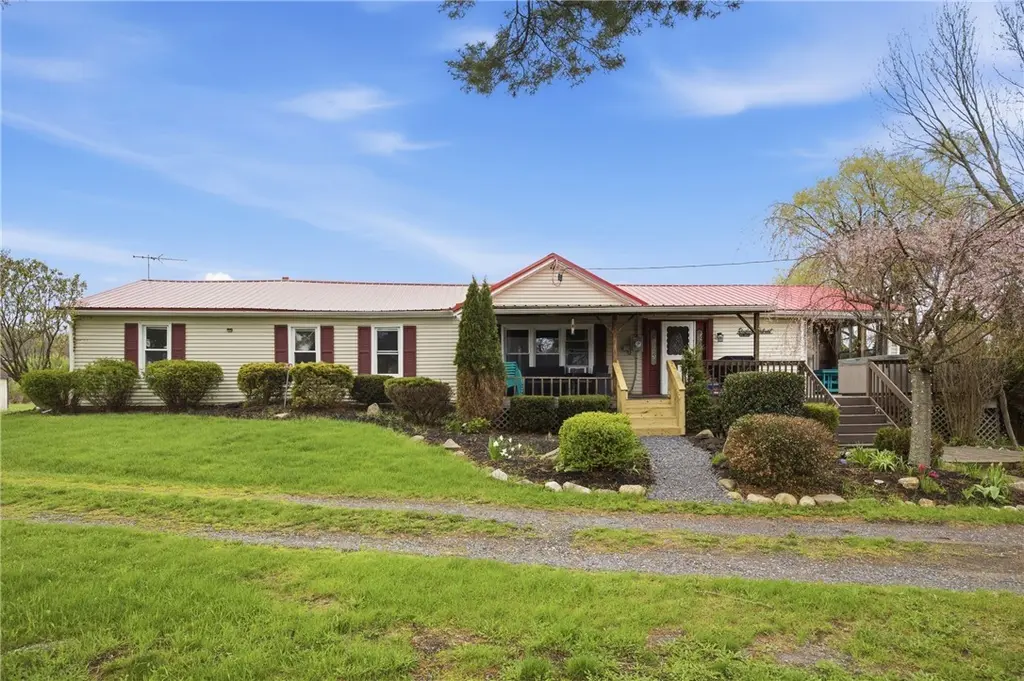
8989 Chidsey Hill Rd
Keuka Park, NY 14418
$338,000F
4 bd · 1.5 ba ·
2,072 sqft ·
Built 1940
· SingleFamily
· Active
· 58 DOM
Cashflow @ list (25.0% down · 7.5%)
Estimated rent
$1,443/mo
Mortgage (P&I)
−$1,773
Tax + insurance
−$362
HOA
−$0
Vac / Maint / Mgmt
−$303
Net cashflow
$-995/mo
Annual
$-11,944/yr
Cap rate
2.76%
Cash-on-cash
-12.62%
DSCR
0.44
1% rule
0.43%
Cash to close
$94,640
Investor read
- This is a 4-bed/1.5-bath single-family listed at $338k.
- At list price, monthly cash flow is $-995 ($-12k/yr) — negative.
- To cash-flow at today's rent, offer at most $162k (52.0% below list).
- To meet the 1% rule (rent ≥ 1% of price), the offer needs to be $144k (57.3% below list).
- It's been on market 58 days — a 3% lower offer ($328k) is reasonable based on typical stale-listing flexibility.
- Recommended offer: $144k (57.3% below list) — sets the bar for 1% rule.
- In year one you build about $36k of equity ($2k loan paydown + $34k appreciation (10.0% local appreciation)).
- Location reads 66/100 on livability (#656 in NY) — a middle-class / working-renter tenant base. Strengths: employment A+, crime A, cost of living B+; Watch: health & safety D, amenities F, commute F.
- Hammondsport Central School District (rural): math 61% / reading 55% proficiency, ranked #305 of 755 in NY (top 40%) — acceptable for families but not a draw, mixed tenant base, ~2y average lease.
- Watch-outs: built in 1940 — expect roof / HVAC / electrical / plumbing capex.
- Market conditions: 15 active listings in the ZIP; 196 units permitted in Steuben County in 2024 (0 in 5+ unit buildings).
- Steuben County population projected at -20% by 2050 — secular population decline; favor cash flow + early exit over multi-decade hold.
- 9 sale attempts since 20y ago with the ask held roughly flat each time — persistent listings suggest the price (not the market) is what's stuck; bring a comps-based counter.
- Current owner paid $216k; list at $338k implies a 56% gain — meaningful room to come down on a strong offer.
- By year 2, paydown + projected appreciation supports a ~$58k cash-out refi (75% LTV) — recoverable capital for the next deal without selling this one.
- Cap rate 2.8% vs local median 1.1% in Keuka Park — top-decile yield for the area; either an underpriced asset or a hidden risk that comps aren't pricing in. Stress-test before assuming the spread holds.
Questions for listing agent
- What do current leases actually rent for vs. the listed asking? Can we see a recent rent roll and the last 12 months of T-12 income?
- It's been on market 58 days. Have you received any prior offers? Is the seller open to a 57% concession, seller financing, or rate buy-down credit?
- Built in 1940 — when were the roof, HVAC, electrical panel, plumbing, and water heater last replaced?
- Is there a deadline driving the sale (1031 exchange, divorce, estate, relocation)? That informs how much negotiation room exists.
- The area grade is low — what's the realistic commute time and amenity access for the typical tenant pool here? Any planned neighborhood developments (good or bad) we should know about?
- What's the average days-on-market for RENTAL listings here right now (not sales)? A rising rental-DOM trend means longer vacancies and softer asking-rent achievability than the comps imply.
- What's the recent tenant-quality profile in this submarket — average credit score on applications, eviction rate, late-payment / NSF rate, and stable-employment percentage? A property-management company in the area should have these aggregated.
- How much new for-sale + rental construction is in the pipeline within 1–3 miles? Heavy new supply typically softens prices + rents 12–24 months out; constrained supply supports both.
CashFlowRE · CFR-QB360732TTMFPB
· Data 2 days ago
cashflowre.app · 2026-05-29