None
Miami, FL 33125
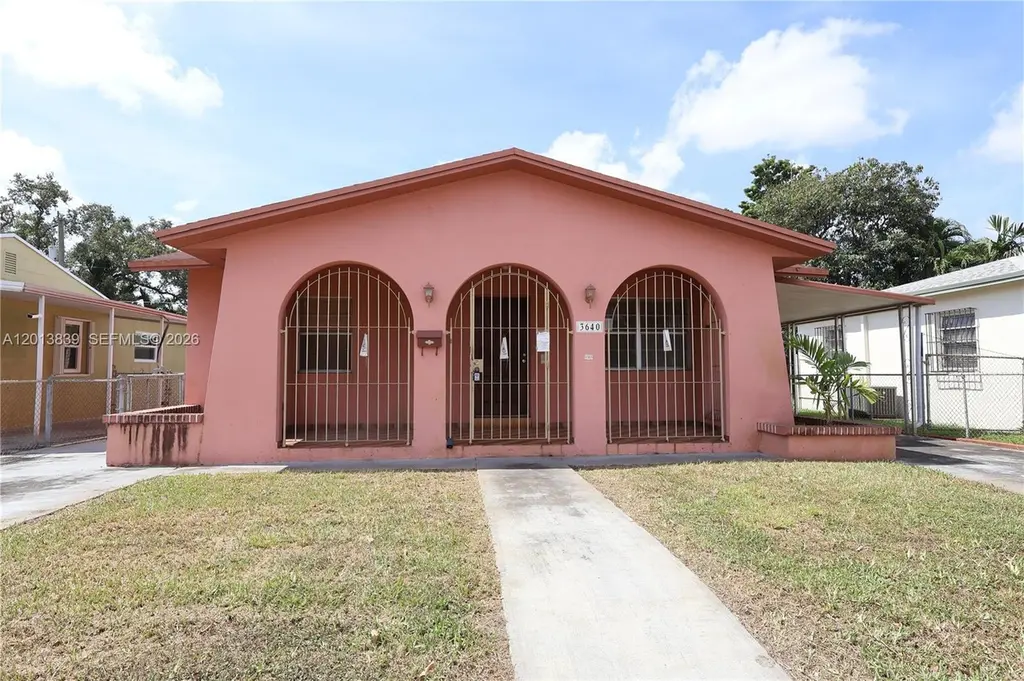
$400,000B
3 bd · 1.0 ba ·
1,453 sqft ·
Built 1948
· MultiFamily
· Pending
· 13 DOM
Cashflow @ list (25.0% down · 7.5%)
Estimated rent
$7,428/mo
Mortgage (P&I)
−$2,098
Tax + insurance
−$1,323
HOA
−$0
Vac / Maint / Mgmt
−$1,560
Net cashflow
$2,448/mo
Annual
$29,375/yr
Cap rate
14.92%
Cash-on-cash
30.80%
DSCR
2.37
1% rule
1.86%
Cash to close
$112,000
Investor read
- This is a 1×2bd/2.0ba + 1×1bd/1.0ba units multifamily listed at $400k.
- At list price, monthly cash flow is $2k ($29k/yr) — positive. Per door: $1k/mo.
- The deal already cash-flows at list — no discount required.
- Meets the 1% rule at list price ($7k rent vs $400k).
- Only 13 days on market — expect competitive offers; lowballing is unlikely to land.
- Local home prices are declining (-3.0%/yr); year-one equity from $3k of loan paydown is wiped out by about $12k of value loss. Plan a longer hold.
- Location reads 78/100 on livability (#177 in FL, #2,724 nationally) — a middle-class / working-renter tenant base. Strengths: amenities A+, commute A+, health & safety A+; Watch: employment C-, crime F, cost of living F.
- Miami-Dade (suburban): math 45% / reading 54% proficiency, ranked #40 of 73 in FL (top 55%) — families likely to look elsewhere, expect single-tenant / working-renter base with shorter leases; 64% free/reduced lunch — lower-income household profile, screen leases tightly.
- Watch-outs: flood insurance adds $427/mo; built in 1948 — expect roof / HVAC / electrical / plumbing capex.
- Market conditions: Rents soft (-1.4%/yr); 239 active listings in the ZIP; lower-income renter base — watch delinquency; 10,051 units permitted in Miami-Dade County in 2024 (7,758 in 5+ unit buildings).
- Miami-Dade County population projected at +28% by 2050 — long-run rental-demand tailwind backs the buy-and-hold thesis.
- Current owner paid $75k; list at $400k implies a 433% gain — meaningful room to come down on a strong offer.
- At projected returns (-3.0% appreciation + 0.0% rent growth), your $112k cash investment doubles in ~6 years — after that, you're playing with house money.
- Climate carrying-cost: in FEMA flood zone AE (mandatory federal flood insurance); severe wind risk, 99% chance of damaging wind over 30y; extreme-heat days projected 4→16/yr by 2055 (HVAC capex compounding) — expect insurance premiums to compound above CPI over the hold.
- Cap rate 14.9% vs local median 1.9% in Miami — top-decile yield for the area; either an underpriced asset or a hidden risk that comps aren't pricing in. Stress-test before assuming the spread holds.
- At $7,428/mo this rent would consume 198% of the median local household income ($45k/yr) (locally 5223% of renters already pay >50% of income on rent) — very limited rent-growth headroom before tenants either downsize or default.
Questions for listing agent
- Can we see the unit-by-unit rent roll, current vacancy, and any below-market leases? What's the average tenancy length?
- What capital expenditures (roof, boiler, parking lot, exteriors) have been made in the last 5 years, and what's planned in the next 2?
- Built in 1948 — when were the roof, HVAC, electrical panel, plumbing, and water heater last replaced?
- What's the actual annual flood-insurance premium (NFIP or private), and is the property in a SFHA with mandatory coverage?
- Is there a deadline driving the sale (1031 exchange, divorce, estate, relocation)? That informs how much negotiation room exists.
- Schools are B-rated — typically a magnet for longer-tenancy family renters. What's the average tenant stay here, and is there a school-zone premium baked into asking?
- Crime grade is F in this area — have there been break-ins, vandalism, or insurance claims at this property in the last 3 years? What carrier currently insures it and at what premium?
- What's the average days-on-market for RENTAL listings here right now (not sales)? A rising rental-DOM trend means longer vacancies and softer asking-rent achievability than the comps imply.
CashFlowRE · CFR-QC03034J297VAC
· Data 3 weeks ago
cashflowre.app · 2026-05-29