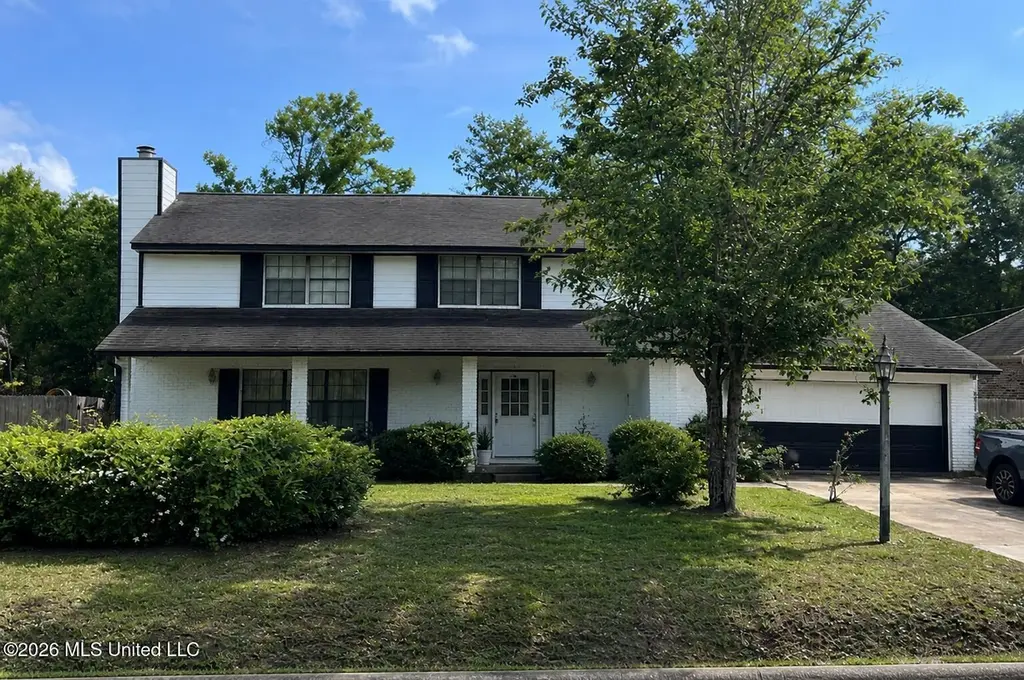
7941 Hilo Way
Diamondhead, MS 39525
$169,000B
3 bd · 2.5 ba ·
1,246 sqft ·
Built 1979
· SingleFamily
· Pending
· 15 DOM
Cashflow @ list (25.0% down · 7.5%)
Estimated rent
$2,133/mo
Mortgage (P&I)
−$886
Tax + insurance
−$126
HOA
−$0
Vac / Maint / Mgmt
−$448
Net cashflow
$673/mo
Annual
$8,071/yr
Cap rate
11.07%
Cash-on-cash
17.06%
DSCR
1.76
1% rule
1.26%
Cash to close
$47,320
Investor read
- This is a 3-bed/2.5-bath single-family listed at $169k.
- At list price, monthly cash flow is $673 ($8k/yr) — positive.
- The deal already cash-flows at list — no discount required.
- Meets the 1% rule at list price ($2k rent vs $169k).
- It's been on market 15 days — a 2% lower offer ($166k) is reasonable based on typical stale-listing flexibility.
- Recommended offer: $166k (1.5% below list) — sets the bar for market timing.
- Local home prices are declining (-3.0%/yr); year-one equity from $1k of loan paydown is wiped out by about $5k of value loss. Plan a longer hold.
- Location reads 68/100 on livability (#59 in MS) — a middle-class / working-renter tenant base. Strengths: crime A+, cost of living A+, housing A+; Watch: amenities F, commute F, health & safety F.
- Hancock County School District (rural): math 47% / reading 44% proficiency, ranked #23 of 130 in MS (top 18%) — families likely to look elsewhere, expect single-tenant / working-renter base with shorter leases.
- Zoned schools: Hancock Middle School (math 48% / reading 44%, grade D+, #39 of 179 statewide, top 22%, 958 students, 100% FRL); Hancock High School (math 42% / reading 43%, grade F, #42 of 197 statewide, top 21%, 1,187 students, 100% FRL) — zoned schools average 100% FRL vs 58% district-wide (41 pts higher); higher-poverty schools than district average — tighter screening recommended.
- Market conditions: 246 active listings in the ZIP; 4 comparable units currently listed for rent nearby; rentals at typical pace (median 21d on market — plan ~3-4 weeks tenant-placement turnaround); solid renter incomes; 248 units permitted in Hancock County in 2024 (0 in 5+ unit buildings).
- Hancock County population projected at +20% by 2050 — long-run rental-demand tailwind backs the buy-and-hold thesis.
- 2 sale attempts since 17y ago; this cycle's ask has dropped $10k (6%) from the opening price — seller is motivated, your offer sets the floor, not the list.
- At projected returns (-3.0% appreciation + 3.0% rent growth), your $47k cash investment doubles in ~8 years — after that, you're playing with house money.
- Climate carrying-cost: severe wind risk, 99% chance of damaging wind over 30y; extreme-heat days projected 7→22/yr by 2055 (HVAC capex compounding) — expect insurance premiums to compound above CPI over the hold.
- Cap rate 11.1% vs local median 4.8% in Diamondhead — top-decile yield for the area; either an underpriced asset or a hidden risk that comps aren't pricing in. Stress-test before assuming the spread holds.
Questions for listing agent
- Built in 1979 — when were the roof, HVAC, electrical panel, plumbing, and water heater last replaced?
- Is there a deadline driving the sale (1031 exchange, divorce, estate, relocation)? That informs how much negotiation room exists.
- What's the average days-on-market for RENTAL listings here right now (not sales)? A rising rental-DOM trend means longer vacancies and softer asking-rent achievability than the comps imply.
- What's the recent tenant-quality profile in this submarket — average credit score on applications, eviction rate, late-payment / NSF rate, and stable-employment percentage? A property-management company in the area should have these aggregated.
- How much new for-sale + rental construction is in the pipeline within 1–3 miles? Heavy new supply typically softens prices + rents 12–24 months out; constrained supply supports both.
CashFlowRE · CFR-QC7YSCA5EMJ8EP
· Data 1 day ago
cashflowre.app · 2026-05-29