11 Legrand St
Howell, MI 48843
$43,000D+
3 bd · 2.0 ba ·
1,300 sqft ·
Built 2019
· Manufactured
· Active
· 223 DOM
Cashflow @ list (25.0% down · 7.5%)
Estimated rent
$2,483/mo
Mortgage (P&I)
−$225
Tax + insurance
−$72
HOA
−$0
Vac / Maint / Mgmt
−$522
Net cashflow
$1,665/mo
Annual
$19,977/yr
Cap rate
52.75%
Cash-on-cash
165.92%
DSCR
8.38
1% rule
5.78%
Cash to close
$12,040
Investor read
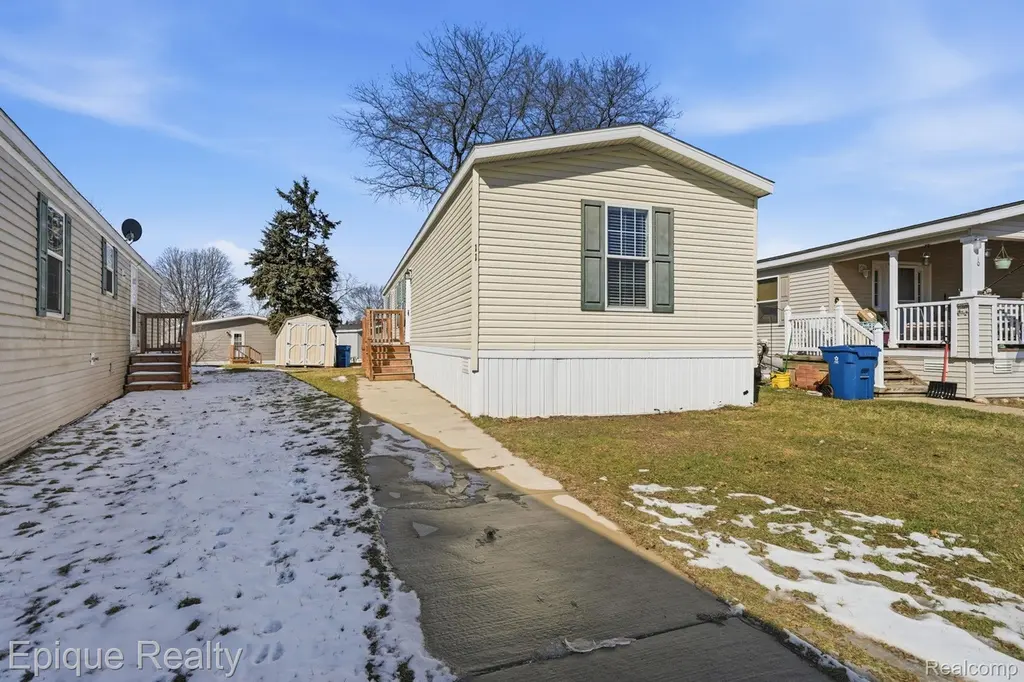
- This is a 3-bed/2.0-bath manufactured listed at $43k. Condition is rated fair.
- At list price, monthly cash flow is $2k ($20k/yr) — positive.
- The deal already cash-flows at list — no discount required.
- Meets the 1% rule at list price ($2k rent vs $43k).
- It's been on market 223 days — a 12% lower offer ($38k) is reasonable based on typical stale-listing flexibility.
- Recommended offer: $38k (12.0% below list) — sets the bar for market timing.
- Local home prices are declining (-3.0%/yr); year-one equity from $297 of loan paydown is wiped out by about $1k of value loss. Plan a longer hold.
- Location reads 78/100 on livability (#107 in MI, #2,598 nationally) — a middle-class / working-renter tenant base. Strengths: crime A+, cost of living A+, housing A+; Watch: commute F.
- Howell Public Schools (suburban): math 41% / reading 52% proficiency, ranked #116 of 540 in MI (top 22%) — families likely to look elsewhere, expect single-tenant / working-renter base with shorter leases.
- Market conditions: 340 active listings in the ZIP; 2 comparable units currently listed for rent nearby; solid renter incomes; 488 units permitted in Livingston County in 2024 (0 in 5+ unit buildings).
- Livingston County population projected at +7% by 2050 — modest demand growth; plan on rents tracking national, not racing it.
- 12 sale attempts since 2y ago with the ask held roughly flat each time — persistent listings suggest the price (not the market) is what's stuck; bring a comps-based counter.
- At projected returns (-3.0% appreciation + 3.0% rent growth), your $12k cash investment doubles in ~1 year — after that, you're playing with house money.
- Cap rate 52.8% vs local median 3.6% in Howell — top-decile yield for the area; either an underpriced asset or a hidden risk that comps aren't pricing in. Stress-test before assuming the spread holds.
- This rent runs 32% of the median local income ($95k/yr) — at the standard rent-burdened threshold; future hikes will face affordability resistance.
Questions for listing agent
- It's been on market 223 days. Have you received any prior offers? Is the seller open to a 12% concession, seller financing, or rate buy-down credit?
- Have any recent inspections been done? Can we get a copy of the seller's disclosures and any deferred-maintenance estimates?
- Why hasn't it sold? Are there any deal-killer items the seller is aware of (foundation, flood, title, zoning, code violations)?
- Is there a deadline driving the sale (1031 exchange, divorce, estate, relocation)? That informs how much negotiation room exists.
- The area grade is low — what's the realistic commute time and amenity access for the typical tenant pool here? Any planned neighborhood developments (good or bad) we should know about?
- What's the average days-on-market for RENTAL listings here right now (not sales)? A rising rental-DOM trend means longer vacancies and softer asking-rent achievability than the comps imply.
- What's the recent tenant-quality profile in this submarket — average credit score on applications, eviction rate, late-payment / NSF rate, and stable-employment percentage? A property-management company in the area should have these aggregated.
- How much new for-sale + rental construction is in the pipeline within 1–3 miles? Heavy new supply typically softens prices + rents 12–24 months out; constrained supply supports both.
Repairs flagged (vision-AI assessment)
- Minor: wooden steps — slight wear
- Minor: wooden deck — slight wear
CashFlowRE · CFR-QCWPTF1DQSC1F2
· Data 2 weeks ago
cashflowre.app · 2026-05-29