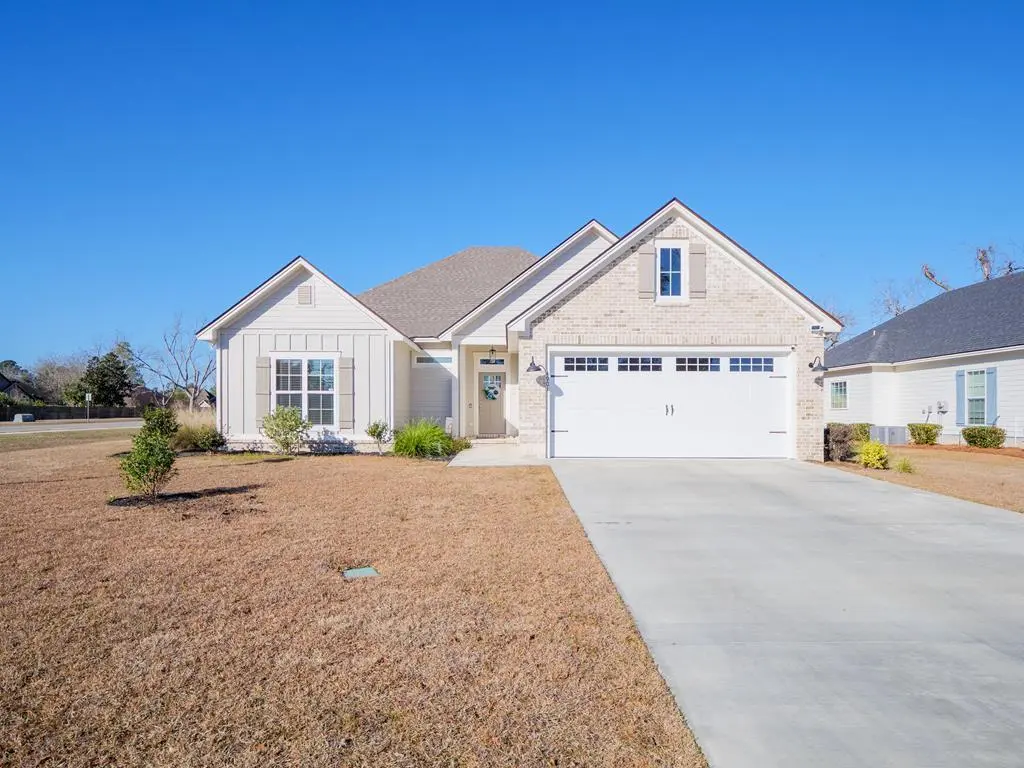
4901 Hatfield Cir
Hahira, GA 31632
$395,000D
4 bd · 2.5 ba ·
2,604 sqft ·
Built 2022
· SingleFamily
· Active
· 15 DOM
Cashflow @ list (25.0% down · 7.5%)
Estimated rent
$2,314/mo
Mortgage (P&I)
−$2,071
Tax + insurance
−$511
HOA
−$24
Vac / Maint / Mgmt
−$486
Net cashflow
$-778/mo
Annual
$-9,339/yr
Cap rate
3.93%
Cash-on-cash
-8.44%
DSCR
0.62
1% rule
0.59%
Cash to close
$110,600
Investor read
- This is a 4-bed/2.5-bath single-family listed at $395k.
- At list price, monthly cash flow is $-778 ($-9k/yr) — negative.
- To cash-flow at today's rent, offer at most $258k (34.8% below list).
- To meet the 1% rule (rent ≥ 1% of price), the offer needs to be $231k (41.4% below list).
- It's been on market 15 days — a 2% lower offer ($389k) is reasonable based on typical stale-listing flexibility.
- Recommended offer: $231k (41.4% below list) — sets the bar for 1% rule.
- In year one you build about $42k of equity ($3k loan paydown + $40k appreciation (10.0% local appreciation)).
- Location reads 67/100 on livability (#161 in GA) — a middle-class / working-renter tenant base. Strengths: cost of living A+, housing A+; Watch: crime C-, employment D+, health & safety D.
- Lowndes County (rural): math 59% / reading 52% proficiency, ranked #8 of 174 in GA (top 5%) — acceptable for families but not a draw, mixed tenant base, ~2y average lease.
- Zoned schools: Westside Elementary School (math 62% / reading 53%, grade C+, #150 of 1,228 statewide, top 12%, 937 students, 41% FRL); Hahira Middle School (math 65% / reading 63%, grade B+, #30 of 470 statewide, top 6%, 859 students, 32% FRL); Lowndes High School (math 69% / reading 51%, grade C+, #14 of 424 statewide, top 3%, 3,201 students, 39% FRL) — zoned schools at 37% FRL track the district average.
- Market conditions: 198 active listings in the ZIP; 1 comparable units currently listed for rent nearby; solid renter incomes; 896 units permitted in Lowndes County in 2024 (0 in 5+ unit buildings).
- Lowndes County population projected at +10% by 2050 — modest demand growth; plan on rents tracking national, not racing it.
- 3 sale attempts since 4y ago with the ask held roughly flat each time — persistent listings suggest the price (not the market) is what's stuck; bring a comps-based counter.
- By year 2, paydown + projected appreciation supports a ~$68k cash-out refi (75% LTV) — recoverable capital for the next deal without selling this one.
- Climate carrying-cost: severe wind risk, 99% chance of damaging wind over 30y; major wildfire risk; extreme-heat days projected 7→19/yr by 2055 (HVAC capex compounding) — expect insurance premiums to compound above CPI over the hold.
- This rent runs 33% of the median local income ($84k/yr) — at the standard rent-burdened threshold; future hikes will face affordability resistance.
Questions for listing agent
- What do current leases actually rent for vs. the listed asking? Can we see a recent rent roll and the last 12 months of T-12 income?
- What does the HOA fee cover, when was the last increase, and are there any pending special assessments or reserve-fund shortfalls?
- Is there a deadline driving the sale (1031 exchange, divorce, estate, relocation)? That informs how much negotiation room exists.
- The area grade is low — what's the realistic commute time and amenity access for the typical tenant pool here? Any planned neighborhood developments (good or bad) we should know about?
- What's the average days-on-market for RENTAL listings here right now (not sales)? A rising rental-DOM trend means longer vacancies and softer asking-rent achievability than the comps imply.
- What's the recent tenant-quality profile in this submarket — average credit score on applications, eviction rate, late-payment / NSF rate, and stable-employment percentage? A property-management company in the area should have these aggregated.
- How much new for-sale + rental construction is in the pipeline within 1–3 miles? Heavy new supply typically softens prices + rents 12–24 months out; constrained supply supports both.
CashFlowRE · CFR-QCZWWF71KYJR41
· Data 10 h ago
cashflowre.app · 2026-05-29