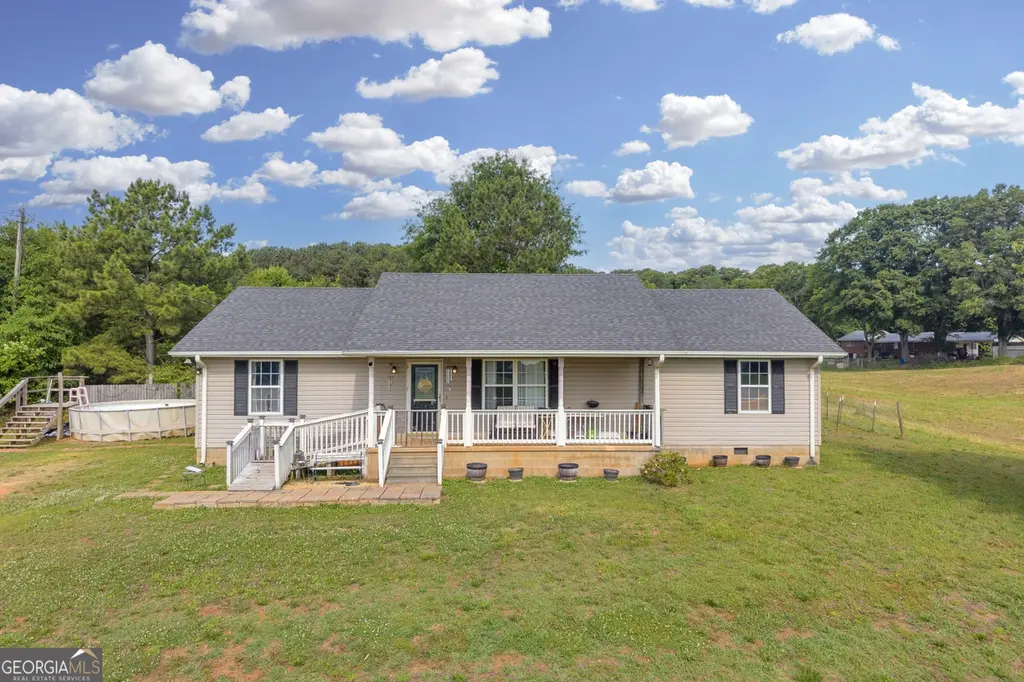
156 Shirley Rd
Royston, GA 30662
$250,000D
2 bd · 1.5 ba ·
1,568 sqft ·
Built 1998
· SingleFamily
· Active
· 23 DOM
Cashflow @ list (25.0% down · 7.5%)
Estimated rent
$1,605/mo
Mortgage (P&I)
−$1,311
Tax + insurance
−$226
HOA
−$0
Vac / Maint / Mgmt
−$337
Net cashflow
$-269/mo
Annual
$-3,233/yr
Cap rate
5.00%
Cash-on-cash
-4.62%
DSCR
0.79
1% rule
0.64%
Cash to close
$70,000
Investor read
- This is a 2-bed/1.5-bath single-family listed at $250k.
- At list price, monthly cash flow is $-269 ($-3k/yr) — negative.
- To cash-flow at today's rent, offer at most $202k (19.0% below list).
- To meet the 1% rule (rent ≥ 1% of price), the offer needs to be $160k (35.8% below list).
- It's been on market 23 days — a 2% lower offer ($246k) is reasonable based on typical stale-listing flexibility.
- Recommended offer: $160k (35.8% below list) — sets the bar for 1% rule.
- In year one you build about $27k of equity ($2k loan paydown + $25k appreciation (10.0% local appreciation)).
- Location reads 58/100 on livability (#421 in GA) — a working-class tenant base; expect higher turnover. Strengths: cost of living A+, housing A, crime B+; Watch: amenities F, commute F, employment F.
- Franklin County (rural): math 38% / reading 35% proficiency, ranked #61 of 174 in GA (top 35%) — families likely to look elsewhere, expect single-tenant / working-renter base with shorter leases.
- Zoned schools: Royston Elementary School (math 54% / reading 38%, grade D-, #316 of 1,228 statewide, top 26%, 493 students, 73% FRL); Franklin County Middle School (math 32% / reading 35%, grade F, #206 of 470 statewide, top 45%, 826 students, 60% FRL).
- Market conditions: 95 active listings in the ZIP; 2 comparable units currently listed for rent nearby; 163 units permitted in Franklin County in 2024 (0 in 5+ unit buildings).
- By year 2, paydown + projected appreciation supports a ~$43k cash-out refi (75% LTV) — recoverable capital for the next deal without selling this one.
- Climate carrying-cost: extreme-heat days projected 7→17/yr by 2055 (HVAC capex compounding) — expect insurance premiums to compound above CPI over the hold.
- Cap rate 5.0% vs local median 4.0% in Royston — meaningfully above typical; check what's discounted (condition, days-on-market, listing class) to confirm the premium yield is real.
- This rent runs 36% of the median local income ($53k/yr) — at the standard rent-burdened threshold; future hikes will face affordability resistance.
Questions for listing agent
- What do current leases actually rent for vs. the listed asking? Can we see a recent rent roll and the last 12 months of T-12 income?
- Is there a deadline driving the sale (1031 exchange, divorce, estate, relocation)? That informs how much negotiation room exists.
- Schools are F-rated, which usually means shorter tenancies and higher turnover. Who's the typical renter profile here, and what's been the actual vacancy rate?
- The area grade is low — what's the realistic commute time and amenity access for the typical tenant pool here? Any planned neighborhood developments (good or bad) we should know about?
- What's the average days-on-market for RENTAL listings here right now (not sales)? A rising rental-DOM trend means longer vacancies and softer asking-rent achievability than the comps imply.
- What's the recent tenant-quality profile in this submarket — average credit score on applications, eviction rate, late-payment / NSF rate, and stable-employment percentage? A property-management company in the area should have these aggregated.
- How much new for-sale + rental construction is in the pipeline within 1–3 miles? Heavy new supply typically softens prices + rents 12–24 months out; constrained supply supports both.
CashFlowRE · CFR-QDNTCDE1RYSF95
· Data 1 day ago
cashflowre.app · 2026-05-29