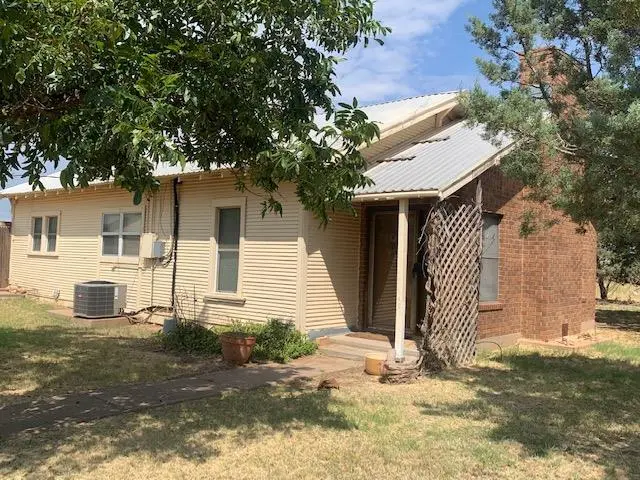
1454 E US Highway 180
Snyder, TX 79549
$65,000B-
2 bd · 2.0 ba ·
1,313 sqft ·
Built 1929
· SingleFamily
· Active
· 1425 DOM
Cashflow @ list (25.0% down · 7.5%)
Estimated rent
$1,334/mo
Mortgage (P&I)
−$341
Tax + insurance
−$182
HOA
−$0
Vac / Maint / Mgmt
−$280
Net cashflow
$531/mo
Annual
$6,377/yr
Cap rate
16.10%
Cash-on-cash
35.04%
DSCR
2.56
1% rule
2.05%
Cash to close
$18,200
Investor read
- This is a 2-bed/2.0-bath single-family listed at $65k.
- At list price, monthly cash flow is $531 ($6k/yr) — positive.
- The deal already cash-flows at list — no discount required.
- Meets the 1% rule at list price ($1k rent vs $65k).
- It's been on market 1425 days — a 12% lower offer ($57k) is reasonable based on typical stale-listing flexibility.
- Recommended offer: $57k (12.0% below list) — sets the bar for market timing.
- Local home prices are declining (-3.0%/yr); year-one equity from $449 of loan paydown is wiped out by about $2k of value loss. Plan a longer hold.
- Location reads 61/100 on livability (#1,008 in TX) — a middle-class / working-renter tenant base. Strengths: cost of living A+, housing A+; Watch: health & safety C-, employment D+, crime F.
- Snyder ISD (town): math 33% / reading 31% proficiency, ranked #577 of 826 in TX (top 70%) — families likely to look elsewhere, expect single-tenant / working-renter base with shorter leases.
- Zoned schools: Snyder Int (math 42% / reading 28%, grade F, #1,965 of 4,322 statewide, top 46%, 362 students, 70% FRL); Snyder J H (math 24% / reading 27%, grade F, #1,236 of 1,662 statewide, top 76%, 594 students, 74% FRL); Snyder H S (math 27% / reading 40%, grade F, #1,011 of 1,632 statewide, top 63%, 709 students, 62% FRL) — zoned schools average 68% FRL vs 49% district-wide (19 pts higher); higher-poverty schools than district average — tighter screening recommended.
- Watch-outs: property tax is 2.9% of price; built in 1929 — expect roof / HVAC / electrical / plumbing capex.
- Market conditions: 107 active listings in the ZIP; 32 units permitted in Scurry County in 2024 (0 in 5+ unit buildings).
- Scurry County population projected at +22% by 2050 — long-run rental-demand tailwind backs the buy-and-hold thesis.
- 2 sale attempts since 5y ago; this cycle's ask has dropped $10k (13%) from the opening price — seller is motivated, your offer sets the floor, not the list.
- At projected returns (-3.0% appreciation + 3.0% rent growth), your $18k cash investment doubles in ~4 years — after that, you're playing with house money.
- Climate carrying-cost: major wildfire risk; extreme-heat days projected 7→22/yr by 2055 (HVAC capex compounding) — expect insurance premiums to compound above CPI over the hold.
Questions for listing agent
- It's been on market 1425 days. Have you received any prior offers? Is the seller open to a 12% concession, seller financing, or rate buy-down credit?
- Built in 1929 — when were the roof, HVAC, electrical panel, plumbing, and water heater last replaced?
- Property tax is high relative to price — has the assessment been appealed recently, and will the sale trigger a re-assessment?
- Why hasn't it sold? Are there any deal-killer items the seller is aware of (foundation, flood, title, zoning, code violations)?
- Is there a deadline driving the sale (1031 exchange, divorce, estate, relocation)? That informs how much negotiation room exists.
- Schools are F-rated, which usually means shorter tenancies and higher turnover. Who's the typical renter profile here, and what's been the actual vacancy rate?
- Crime grade is F in this area — have there been break-ins, vandalism, or insurance claims at this property in the last 3 years? What carrier currently insures it and at what premium?
- What's the average days-on-market for RENTAL listings here right now (not sales)? A rising rental-DOM trend means longer vacancies and softer asking-rent achievability than the comps imply.
CashFlowRE · CFR-QE1GJZEMPD3KCP
· Data 2 days ago
cashflowre.app · 2026-05-29