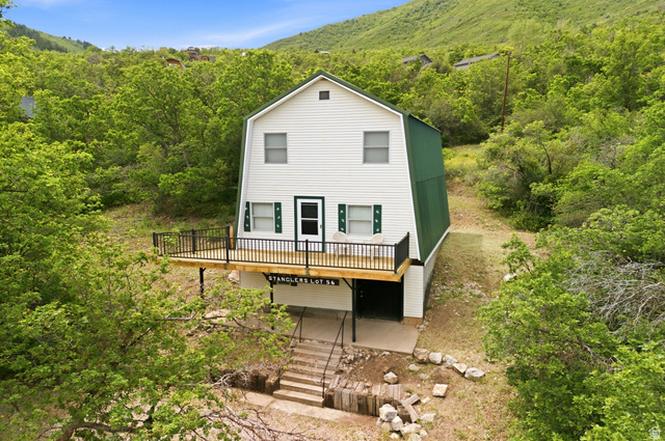
1095 W Acorn Ln #56
Midway, UT 84049
$483,500D
4 bd · 1.5 ba ·
1,280 sqft ·
Built 1990
· SingleFamily
· Active
· 3 DOM
Cashflow @ list (25.0% down · 7.5%)
Estimated rent
$4,296/mo
Mortgage (P&I)
−$2,536
Tax + insurance
−$872
HOA
−$42
Vac / Maint / Mgmt
−$902
Net cashflow
$-56/mo
Annual
$-676/yr
Cap rate
6.32%
Cash-on-cash
0.09%
DSCR
1.00
1% rule
0.89%
Cash to close
$135,380
Investor read
- This is a 4-bed/1.5-bath single-family listed at $484k. Condition is rated fair.
- At list price, monthly cash flow is $-56 ($-676/yr) — negative.
- To cash-flow at today's rent, offer at most $475k (1.7% below list).
- To meet the 1% rule (rent ≥ 1% of price), the offer needs to be $430k (11.2% below list).
- Only 3 days on market — expect competitive offers; lowballing is unlikely to land.
- Recommended offer: $430k (11.2% below list) — sets the bar for 1% rule.
- Local home prices are declining (-3.0%/yr); year-one equity from $3k of loan paydown is wiped out by about $15k of value loss. Plan a longer hold.
- Location reads 67/100 on livability (#124 in UT) — a middle-class / working-renter tenant base. Strengths: crime A+, employment A+, housing A; Watch: amenities F, commute F, cost of living F.
- Wasatch District (town): math 45% / reading 51% proficiency, ranked #23 of 80 in UT (top 29%) — families likely to look elsewhere, expect single-tenant / working-renter base with shorter leases.
- Zoned schools: Midway School (math 63% / reading 66%, grade B, #23 of 585 statewide, top 4%, 675 students, 18% FRL); Rocky Mountain Middle (math 40% / reading 50%, grade D, #43 of 138 statewide, top 33%, 717 students, 26% FRL); Wasatch High (math 34% / reading 50%, grade F, #55 of 171 statewide, top 32%, 2,531 students, 16% FRL).
- Watch-outs: flood insurance adds $66/mo.
- Market conditions: 228 active listings in the ZIP; 1 comparable units currently listed for rent nearby; high-income renter base; 835 units permitted in Wasatch County in 2024 (22 in 5+ unit buildings).
- Wasatch County population projected at +87% by 2050 — long-run rental-demand tailwind backs the buy-and-hold thesis.
- Climate carrying-cost: severe flood risk; major wildfire risk — expect insurance premiums to compound above CPI over the hold.
- Cap rate 6.3% vs local median 2.4% in Midway — top-decile yield for the area; either an underpriced asset or a hidden risk that comps aren't pricing in. Stress-test before assuming the spread holds.
- This rent runs 34% of the median local income ($151k/yr) — at the standard rent-burdened threshold; future hikes will face affordability resistance.
Questions for listing agent
- What do current leases actually rent for vs. the listed asking? Can we see a recent rent roll and the last 12 months of T-12 income?
- Have any recent inspections been done? Can we get a copy of the seller's disclosures and any deferred-maintenance estimates?
- What's the actual annual flood-insurance premium (NFIP or private), and is the property in a SFHA with mandatory coverage?
- What does the HOA fee cover, when was the last increase, and are there any pending special assessments or reserve-fund shortfalls?
- Is there a deadline driving the sale (1031 exchange, divorce, estate, relocation)? That informs how much negotiation room exists.
- Schools are A-rated — typically a magnet for longer-tenancy family renters. What's the average tenant stay here, and is there a school-zone premium baked into asking?
- The area grade is low — what's the realistic commute time and amenity access for the typical tenant pool here? Any planned neighborhood developments (good or bad) we should know about?
- What's the average days-on-market for RENTAL listings here right now (not sales)? A rising rental-DOM trend means longer vacancies and softer asking-rent achievability than the comps imply.
Repairs flagged (vision-AI assessment)
- Moderate: Exterior siding — Weathered and in need of repainting
- Minor: Interior walls — Some paint wear
CashFlowRE · CFR-QF19XF1TJA2AW9
· Data 12 h ago
cashflowre.app · 2026-05-29