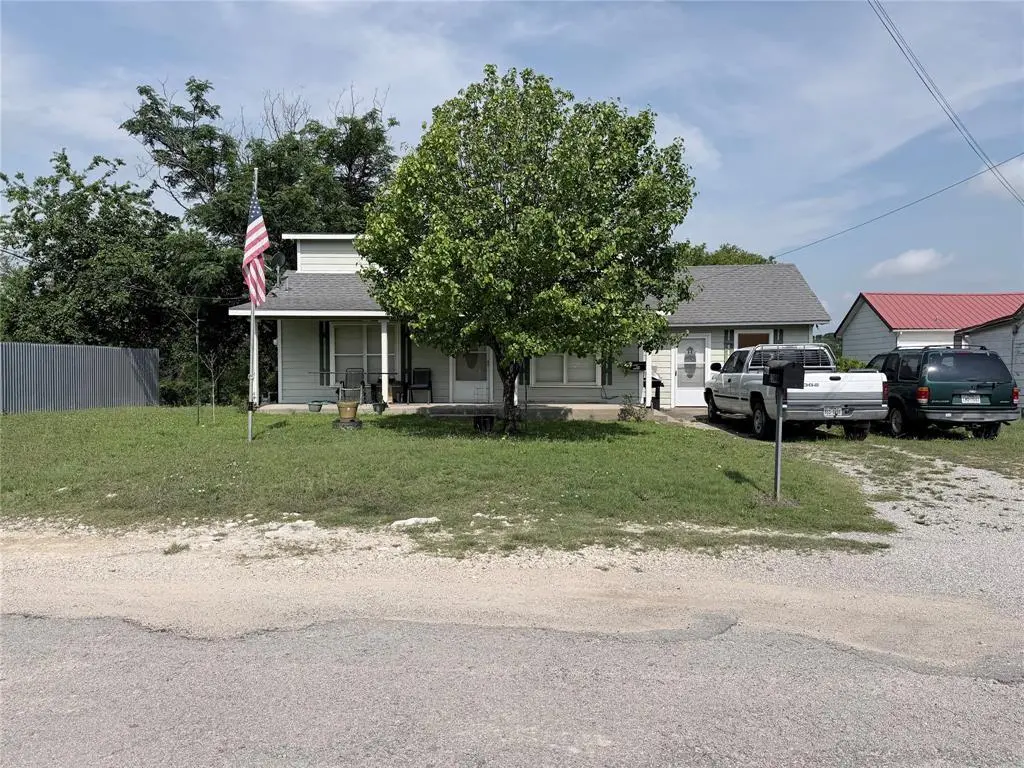
403 N Reagan St
Hamilton, TX 76531
$159,000C
3 bd · 1.0 ba ·
1,952 sqft ·
Built 1950
· SingleFamily
· Active
· 25 DOM
Cashflow @ list (25.0% down · 7.5%)
Estimated rent
$1,395/mo
Mortgage (P&I)
−$834
Tax + insurance
−$275
HOA
−$0
Vac / Maint / Mgmt
−$293
Net cashflow
$-7/mo
Annual
$-86/yr
Cap rate
6.24%
Cash-on-cash
-0.19%
DSCR
0.99
1% rule
0.88%
Cash to close
$44,520
Investor read
- This is a 3-bed/1.0-bath single-family listed at $159k.
- At list price, monthly cash flow is $-7 ($-86/yr) — negative.
- To cash-flow at today's rent, offer at most $158k (0.8% below list).
- To meet the 1% rule (rent ≥ 1% of price), the offer needs to be $140k (12.3% below list).
- It's been on market 25 days — a 2% lower offer ($157k) is reasonable based on typical stale-listing flexibility.
- Recommended offer: $140k (12.3% below list) — sets the bar for 1% rule.
- In year one you build about $17k of equity ($1k loan paydown + $16k appreciation (10.0% local appreciation)).
- Location reads 73/100 on livability (#210 in TX) — a middle-class / working-renter tenant base. Strengths: cost of living A+, housing A+, health & safety A+; Watch: employment D, amenities F, commute F.
- Hamilton ISD (town): math 50% / reading 50% proficiency, ranked #192 of 826 in TX (top 23%) — acceptable for families but not a draw, mixed tenant base, ~2y average lease.
- Zoned schools: Ann Whitney El (math 42% / reading 42%, grade F, #1,335 of 4,322 statewide, top 33%, 397 students, 60% FRL); Hamilton J H (math 52% / reading 52%, grade C+, #301 of 1,662 statewide, top 19%, 184 students, 53% FRL); Hamilton H S (math 62% / reading 57%, grade C+, #275 of 1,632 statewide, top 19%, 236 students, 43% FRL) — zoned schools at 52% FRL track the district average.
- Watch-outs: built in 1950 — expect roof / HVAC / electrical / plumbing capex.
- Market conditions: 117 active listings in the ZIP; 1 comparable units currently listed for rent nearby; 24 units permitted in Hamilton County in 2024 (0 in 5+ unit buildings).
- Hamilton County population projected at -21% by 2050 — secular population decline; favor cash flow + early exit over multi-decade hold.
- At projected returns (10.0% appreciation + 3.0% rent growth), your $45k cash investment doubles in ~3 years — after that, you're playing with house money.
- By year 3, paydown + projected appreciation supports a ~$43k cash-out refi (75% LTV) — recoverable capital for the next deal without selling this one.
- Climate carrying-cost: major wind risk, 27% chance of damaging wind over 30y; major wildfire risk; extreme-heat days projected 7→23/yr by 2055 (HVAC capex compounding) — expect insurance premiums to compound above CPI over the hold.
- Cap rate 6.2% vs local median 2.7% in Hamilton — top-decile yield for the area; either an underpriced asset or a hidden risk that comps aren't pricing in. Stress-test before assuming the spread holds.
Questions for listing agent
- What do current leases actually rent for vs. the listed asking? Can we see a recent rent roll and the last 12 months of T-12 income?
- Built in 1950 — when were the roof, HVAC, electrical panel, plumbing, and water heater last replaced?
- Is there a deadline driving the sale (1031 exchange, divorce, estate, relocation)? That informs how much negotiation room exists.
- What's the average days-on-market for RENTAL listings here right now (not sales)? A rising rental-DOM trend means longer vacancies and softer asking-rent achievability than the comps imply.
- What's the recent tenant-quality profile in this submarket — average credit score on applications, eviction rate, late-payment / NSF rate, and stable-employment percentage? A property-management company in the area should have these aggregated.
- How much new for-sale + rental construction is in the pipeline within 1–3 miles? Heavy new supply typically softens prices + rents 12–24 months out; constrained supply supports both.
CashFlowRE · CFR-QH1CJ93GJ7H9J0
· Data 11 h ago
cashflowre.app · 2026-05-29