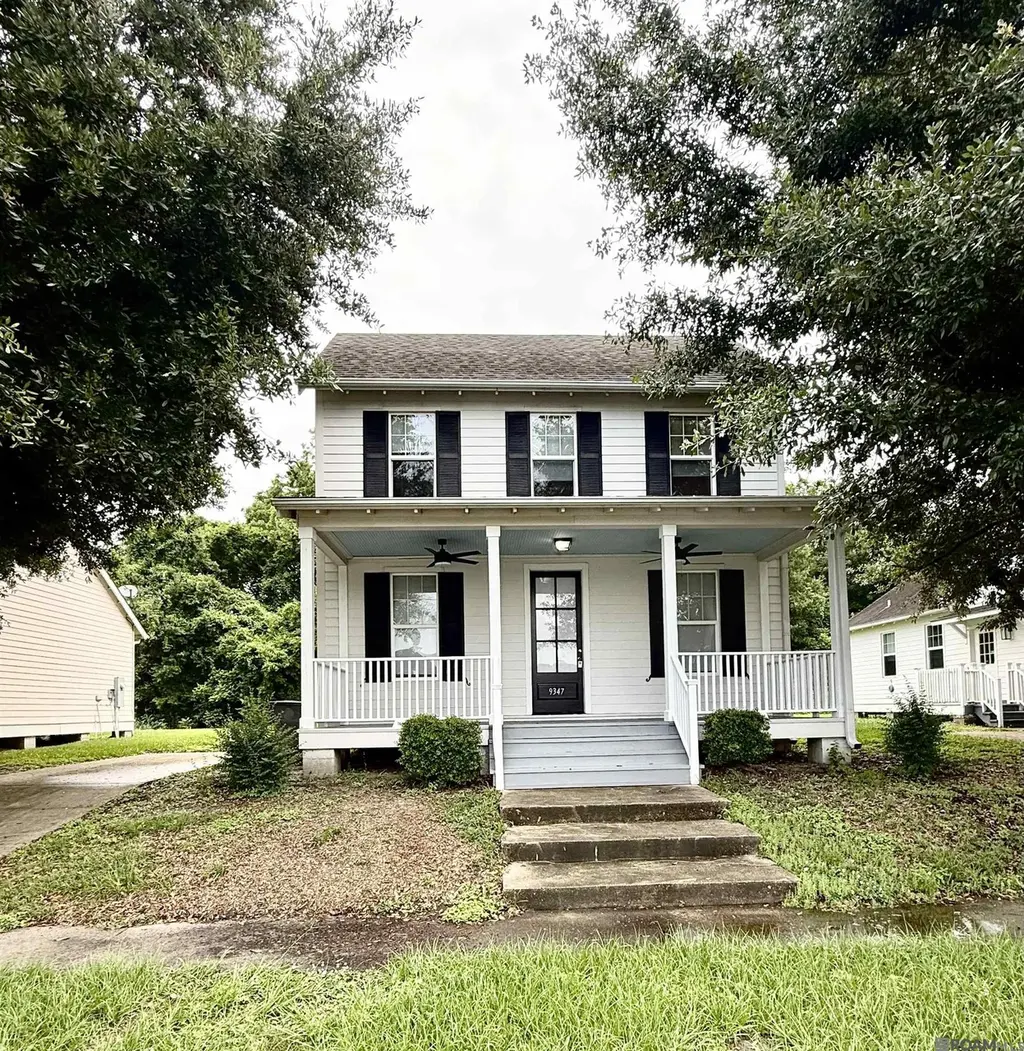
9347 Bimini Dr
Gardere, LA 70810
$120,000D
2 bd · 1.5 ba ·
936 sqft ·
Built 2009
· SingleFamily
· Pending
· 12 DOM
Cashflow @ list (25.0% down · 7.5%)
Estimated rent
$1,086/mo
Mortgage (P&I)
−$629
Tax + insurance
−$224
HOA
−$0
Vac / Maint / Mgmt
−$228
Net cashflow
$5/mo
Annual
$59/yr
Cap rate
7.01%
Cash-on-cash
2.55%
DSCR
1.11
1% rule
0.91%
Cash to close
$33,600
Investor read
- This is a 2-bed/1.5-bath single-family listed at $120k.
- At list price, monthly cash flow is $5 ($59/yr) — positive.
- The deal already cash-flows at list — no discount required.
- To meet the 1% rule (rent ≥ 1% of price), the offer needs to be $109k (9.5% below list).
- Only 12 days on market — expect competitive offers; lowballing is unlikely to land.
- Recommended offer: $109k (9.5% below list) — sets the bar for 1% rule.
- Local home prices are declining (-3.0%/yr); year-one equity from $830 of loan paydown is wiped out by about $4k of value loss. Plan a longer hold.
- Location reads 64/100 on livability (#167 in LA) — a middle-class / working-renter tenant base. Strengths: cost of living A, housing A; Watch: crime D, employment D, amenities F.
- East Baton Rouge Parish (urban): math 22% / reading 34% proficiency, ranked #47 of 98 in LA (top 48%) — low school quality limits family demand, transient renter base, plan for 1-2y turnover; 77% free/reduced lunch — lower-income household profile, screen leases tightly.
- Watch-outs: flood insurance adds $66/mo.
- Market conditions: Rents flat; 625 active listings in the ZIP; 40 comparable units currently listed for rent nearby; rentals lingering (median 44d on market — plan ~5-8 weeks vacancy on turnover, expect pricing pressure); 50% of comp listings sitting > 30 days — soft ceiling on asking rent; solid renter incomes; 2,252 units permitted in East Baton Rouge Parish in 2024 (440 in 5+ unit buildings).
- East Baton Rouge County population projected at +4% by 2050 — modest demand growth; plan on rents tracking national, not racing it.
- 2 sale attempts with the ask held roughly flat each time — persistent listings suggest the price (not the market) is what's stuck; bring a comps-based counter.
- Climate carrying-cost: major flood risk; severe wind risk, 99% chance of damaging wind over 30y; extreme-heat days projected 7→21/yr by 2055 (HVAC capex compounding) — expect insurance premiums to compound above CPI over the hold.
- Cap rate 7.0% vs local median 4.1% in Gardere — top-decile yield for the area; either an underpriced asset or a hidden risk that comps aren't pricing in. Stress-test before assuming the spread holds.
- This rent is only 14% of the median local income ($92k/yr) — well below the 30% rent-burden line; pricing power to push rent on renewal without tenant pushback.
Questions for listing agent
- What's the actual annual flood-insurance premium (NFIP or private), and is the property in a SFHA with mandatory coverage?
- Is there a deadline driving the sale (1031 exchange, divorce, estate, relocation)? That informs how much negotiation room exists.
- Crime grade is D in this area — have there been break-ins, vandalism, or insurance claims at this property in the last 3 years? What carrier currently insures it and at what premium?
- The area grade is low — what's the realistic commute time and amenity access for the typical tenant pool here? Any planned neighborhood developments (good or bad) we should know about?
- What's the average days-on-market for RENTAL listings here right now (not sales)? A rising rental-DOM trend means longer vacancies and softer asking-rent achievability than the comps imply.
- What's the recent tenant-quality profile in this submarket — average credit score on applications, eviction rate, late-payment / NSF rate, and stable-employment percentage? A property-management company in the area should have these aggregated.
- How much new for-sale + rental construction is in the pipeline within 1–3 miles? Heavy new supply typically softens prices + rents 12–24 months out; constrained supply supports both.
CashFlowRE · CFR-QJ4FPEAQ91QSE3
· Data 2 weeks ago
cashflowre.app · 2026-05-29