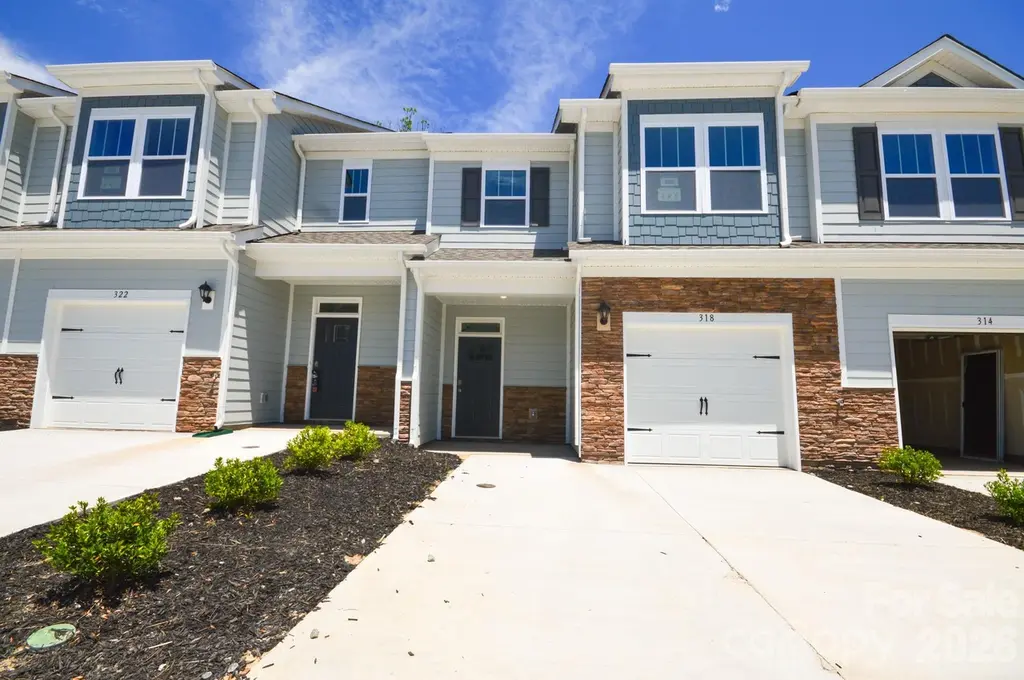
405 Creekview Rd
Hendersonville, NC 28792
$329,000D-
3 bd · 2.5 ba ·
1,699 sqft ·
Built 2026
· Townhouse
· Active
· 16 DOM
Cashflow @ list (25.0% down · 7.5%)
Estimated rent
$2,421/mo
Mortgage (P&I)
−$1,725
Tax + insurance
−$193
HOA
−$150
Vac / Maint / Mgmt
−$508
Net cashflow
$-156/mo
Annual
$-1,867/yr
Cap rate
5.73%
Cash-on-cash
-2.03%
DSCR
0.91
1% rule
0.74%
Cash to close
$92,120
Investor read
- This is a 3-bed/2.5-bath townhouse listed at $329k.
- At list price, monthly cash flow is $-156 ($-2k/yr) — negative.
- To cash-flow at today's rent, offer at most $302k (8.4% below list).
- To meet the 1% rule (rent ≥ 1% of price), the offer needs to be $242k (26.4% below list).
- It's been on market 16 days — a 2% lower offer ($324k) is reasonable based on typical stale-listing flexibility.
- Recommended offer: $242k (26.4% below list) — sets the bar for 1% rule.
- Local home prices are declining (-3.0%/yr); year-one equity from $2k of loan paydown is wiped out by about $10k of value loss. Plan a longer hold.
- Location reads 77/100 on livability (#29 in NC, #2,939 nationally) — a middle-class / working-renter tenant base. Strengths: amenities A+, cost of living A+, health & safety A+; Watch: crime D+, employment D+, commute F.
- Henderson County Schools (suburban): math 48% / reading 52% proficiency, ranked #64 of 178 in NC (top 36%) — acceptable for families but not a draw, mixed tenant base, ~2y average lease.
- Zoned schools: Sugarloaf Elementary (math 47% / reading 40%, grade F, #618 of 1,410 statewide, top 44%, 416 students, 81% FRL); Hendersonville High (math 57% / reading 77%, grade B, #142 of 535 statewide, top 28%, 784 students, 43% FRL) — zoned schools average 62% FRL vs 46% district-wide (16 pts higher); higher-poverty schools than district average — tighter screening recommended.
- Market conditions: Rents rising (+3.6%/yr); 364 active listings in the ZIP; 9 comparable units currently listed for rent nearby; rentals at typical pace (median 24d on market — plan ~3-4 weeks tenant-placement turnaround); 1,534 units permitted in Henderson County in 2024 (558 in 5+ unit buildings).
- Henderson County population projected at +20% by 2050 — long-run rental-demand tailwind backs the buy-and-hold thesis.
- Cap rate 5.7% vs local median 3.5% in Hendersonville — top-decile yield for the area; either an underpriced asset or a hidden risk that comps aren't pricing in. Stress-test before assuming the spread holds.
- At $2,421/mo this rent would consume 52% of the median local household income ($56k/yr) (locally 1420% of renters already pay >50% of income on rent) — very limited rent-growth headroom before tenants either downsize or default.
Questions for listing agent
- What do current leases actually rent for vs. the listed asking? Can we see a recent rent roll and the last 12 months of T-12 income?
- What does the HOA fee cover, when was the last increase, and are there any pending special assessments or reserve-fund shortfalls?
- Is there a deadline driving the sale (1031 exchange, divorce, estate, relocation)? That informs how much negotiation room exists.
- Crime grade is D in this area — have there been break-ins, vandalism, or insurance claims at this property in the last 3 years? What carrier currently insures it and at what premium?
- The area grade is low — what's the realistic commute time and amenity access for the typical tenant pool here? Any planned neighborhood developments (good or bad) we should know about?
- What's the average days-on-market for RENTAL listings here right now (not sales)? A rising rental-DOM trend means longer vacancies and softer asking-rent achievability than the comps imply.
- What's the recent tenant-quality profile in this submarket — average credit score on applications, eviction rate, late-payment / NSF rate, and stable-employment percentage? A property-management company in the area should have these aggregated.
- How much new for-sale + rental construction is in the pipeline within 1–3 miles? Heavy new supply typically softens prices + rents 12–24 months out; constrained supply supports both.
CashFlowRE · CFR-QMZMK7D7VMZSST
· Data 2 days ago
cashflowre.app · 2026-05-29